Development Tools
Overview
Teaching: 0 min
Exercises: 0 minQuestions
Are there any tools that can help make software development easier?
How can I locate faults in my code?
Objectives
Explain what an Integrated Development Environment (IDE) is.
Describe the common features of IDEs.
Describe the process of using a debugger to find faults in programs.
As we have already seen, even a simple software project is typically split into smaller functional units and modules which are kept in separate files and subdirectories. As your code starts to grow and becomes more complex, it will involve many different coding-related files and external libraries. To help you manage this complexity, Integrated Development Environments (or IDEs) present helpful development tools and visualisation aids to help make writing code easier and more productive. We’ll also take a closer look at debugging, a tool common to IDEs and very useful development technique for finding coding errors as programs are running.
Integrated Development Environments (IDEs)
An IDE normally consists of at least a source code editor, build automation tools (for compiling or assembling code into a form to run or distribute to others) and a debugger. The boundaries between modern IDEs and other aspects of the broader software development process are often blurred, as nowadays IDEs also offer version control support, tools to construct graphical user interfaces (GUI) and web browser integration for web app development, source code inspection for dependencies and many other useful functionalities.
The following is a list of the most commonly seen IDE features:
- Syntax highlighting: to show programming language constructs, keywords and the syntax errors with visually distinct colours and font effects
- Code completion: to speed up programming by offering a set of possible (syntactically correct) code options
- Code search: finding package, class, function and variable declarations, their usages and referencing
- Version control support: to quickly add and commit new changes to source code repositories, without the need to use the command line
- Debugging: the ability to inspect the state of a program and its variables as it runs by pausing (and stepping through) it’s code line by line
IDEs are extremely useful and modern software development would be very hard without them. For example, there are a number of IDEs available for Python development; a good overview is available from the Python Project Wiki.
Code editors can be as simple as a text editor with syntax highlighting and code formatting capabilities, but many also have features common to full IDEs, such as code execution and debugging, and some can also interact with a version control system. Compared to an IDE, a good dedicated code editor is usually smaller and quicker, but often less feature-rich. You will have to decide which one is the best for you.
Some examples of IDEs and code editors available for Windows, Linux and Mac OS:
- JetBrains PyCharm, a free, comprehensive, open source Python IDE with many powerful features including the ones listed above.
- Eclipse, one of the most popular IDEs used for development of C/C++, JavaScript, PHP and other languages.
- Apache Netbeans, a popular IDE for Java development, but also for JavaScript, PHP, HTML5, and others.
- Microsoft Visual Studio Code, a popular and free Microsoft code editor which is more lightweight with a gentler learning curve than IDEs like PyCharm, but still has many useful features including code completion, syntax highlighting, debugging, and version control support. It’s also able to work with many different programming languages.
Visual Studio Code: an Example
A typical IDE gives you an interface that looks something like this (taken from Microsoft’s Visual Studio Code):
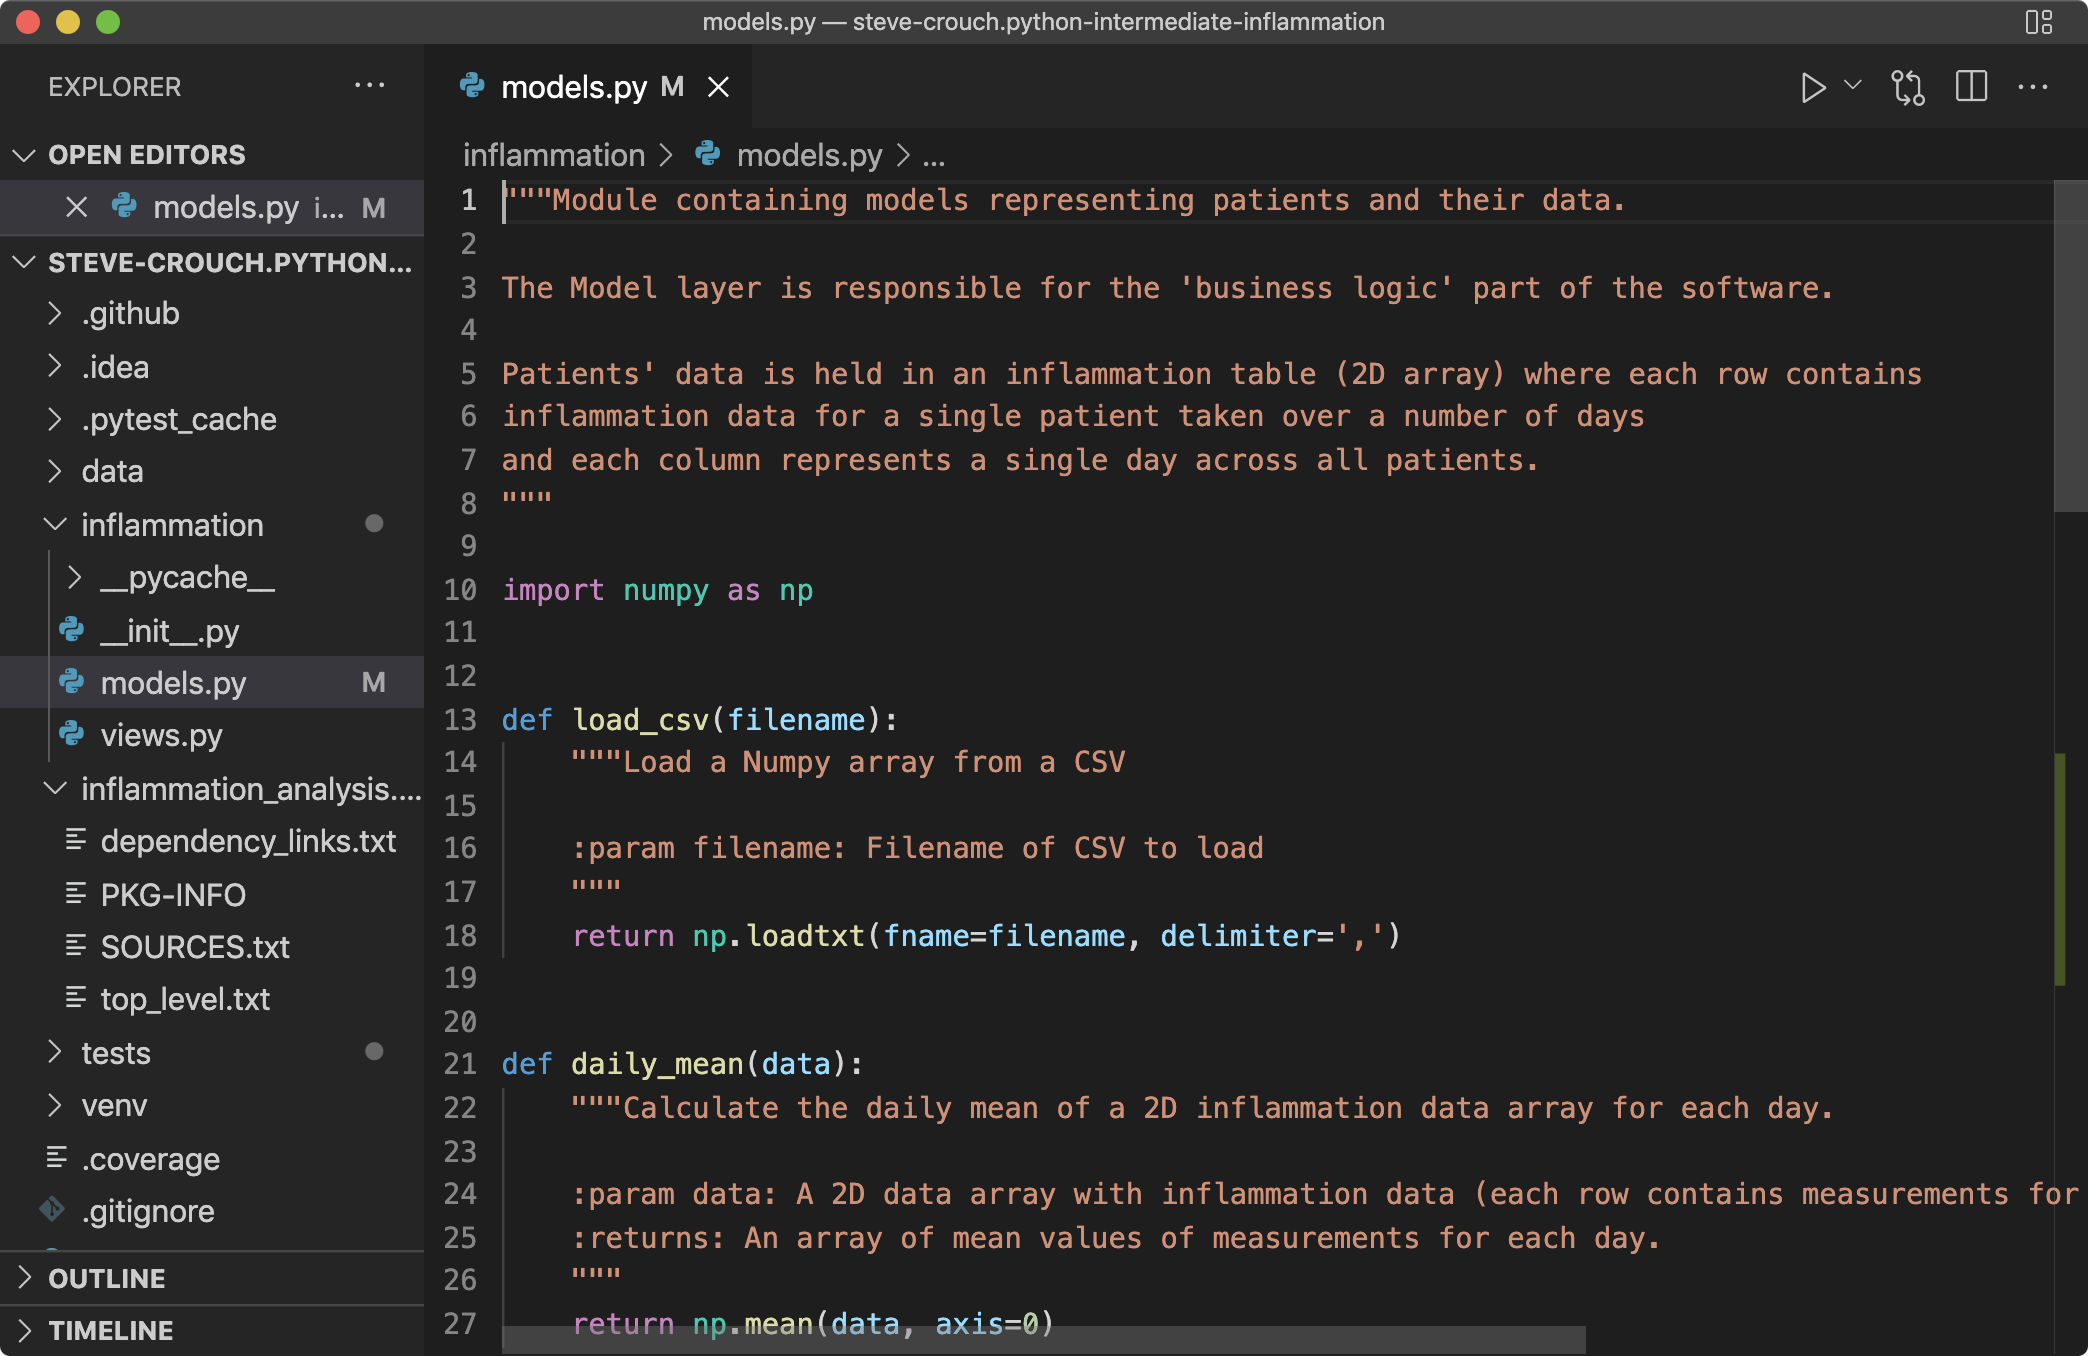
On the left there’s a file navigator, allowing you see and select files for editing. The right side is dedicated to the IDE’s code editor, presenting code that typically colour-highlights the code’s syntax - and potentially any formatting errors in your code. The code editor may have many files open at once. In the top right above the code editor there are buttons allowing you to run the code directly or within a debugger, another to show you any changes from the last version committed to its version control repository, and one to duplicate the current code editing view, which is handy if you need to see one part of the file whilst editing another.
So the key benefit is that features that help deal with common software development tasks are within easy reach, and integrated within a single application with the aim to increase how productive you can be when writing software.
Using a Debugger to Find Code Problems
Testing can tell us something is wrong in our code and give a rough idea of where the error is by which test(s) are failing. But it does not tell us exactly where the problem is (i.e. what line of code), or how it came about. To give us a better idea of what is going on, we can:
- Output program state at various points, e.g. by using print statements to output the contents of variables,
- Use a logging capability to output the state of everything as the program progresses, or
- Look at intermediately generated files.
But such approaches are often time consuming and sometimes not enough to fully pinpoint the issue. In complex programs, like simulation codes, we often need to get inside the code while it is running and explore. This is where using a debugger can be useful. You can think of debugging like performing exploratory surgery, but on code. Debuggers allow us to peer at the internal workings of a program, such as variables and other state, as it performs its functions.
PyCharm: a Debugging Example
Let’s look at a different IDE for an example of debugging - PyCharm.
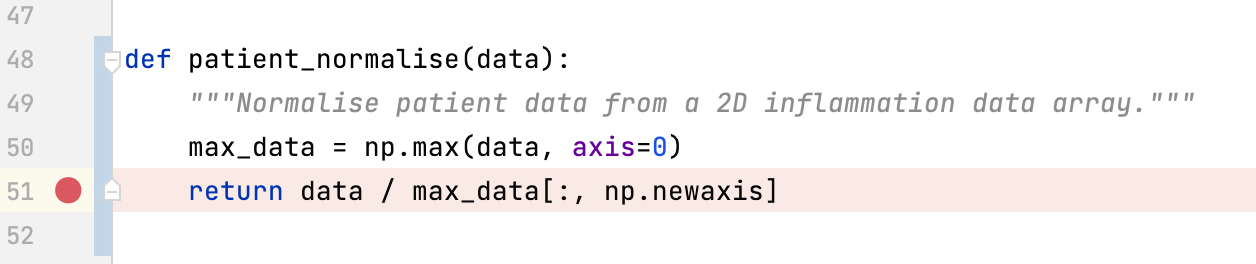
Let’s assume we want to use the debugger to investigate what is happening inside a particular function called patient_normalise. To do this we will add a breakpoint in the code. A breakpoint will pause execution at that point allowing us to explore the state of the program:
Note the similarity in layout with Visual Studio Code - with the file navigation on the left, code editor on the right, and other controls at the top which is very typical of IDEs.
Once we run the code within PyCharm’s debugger, two sections appear that looks something like the following:
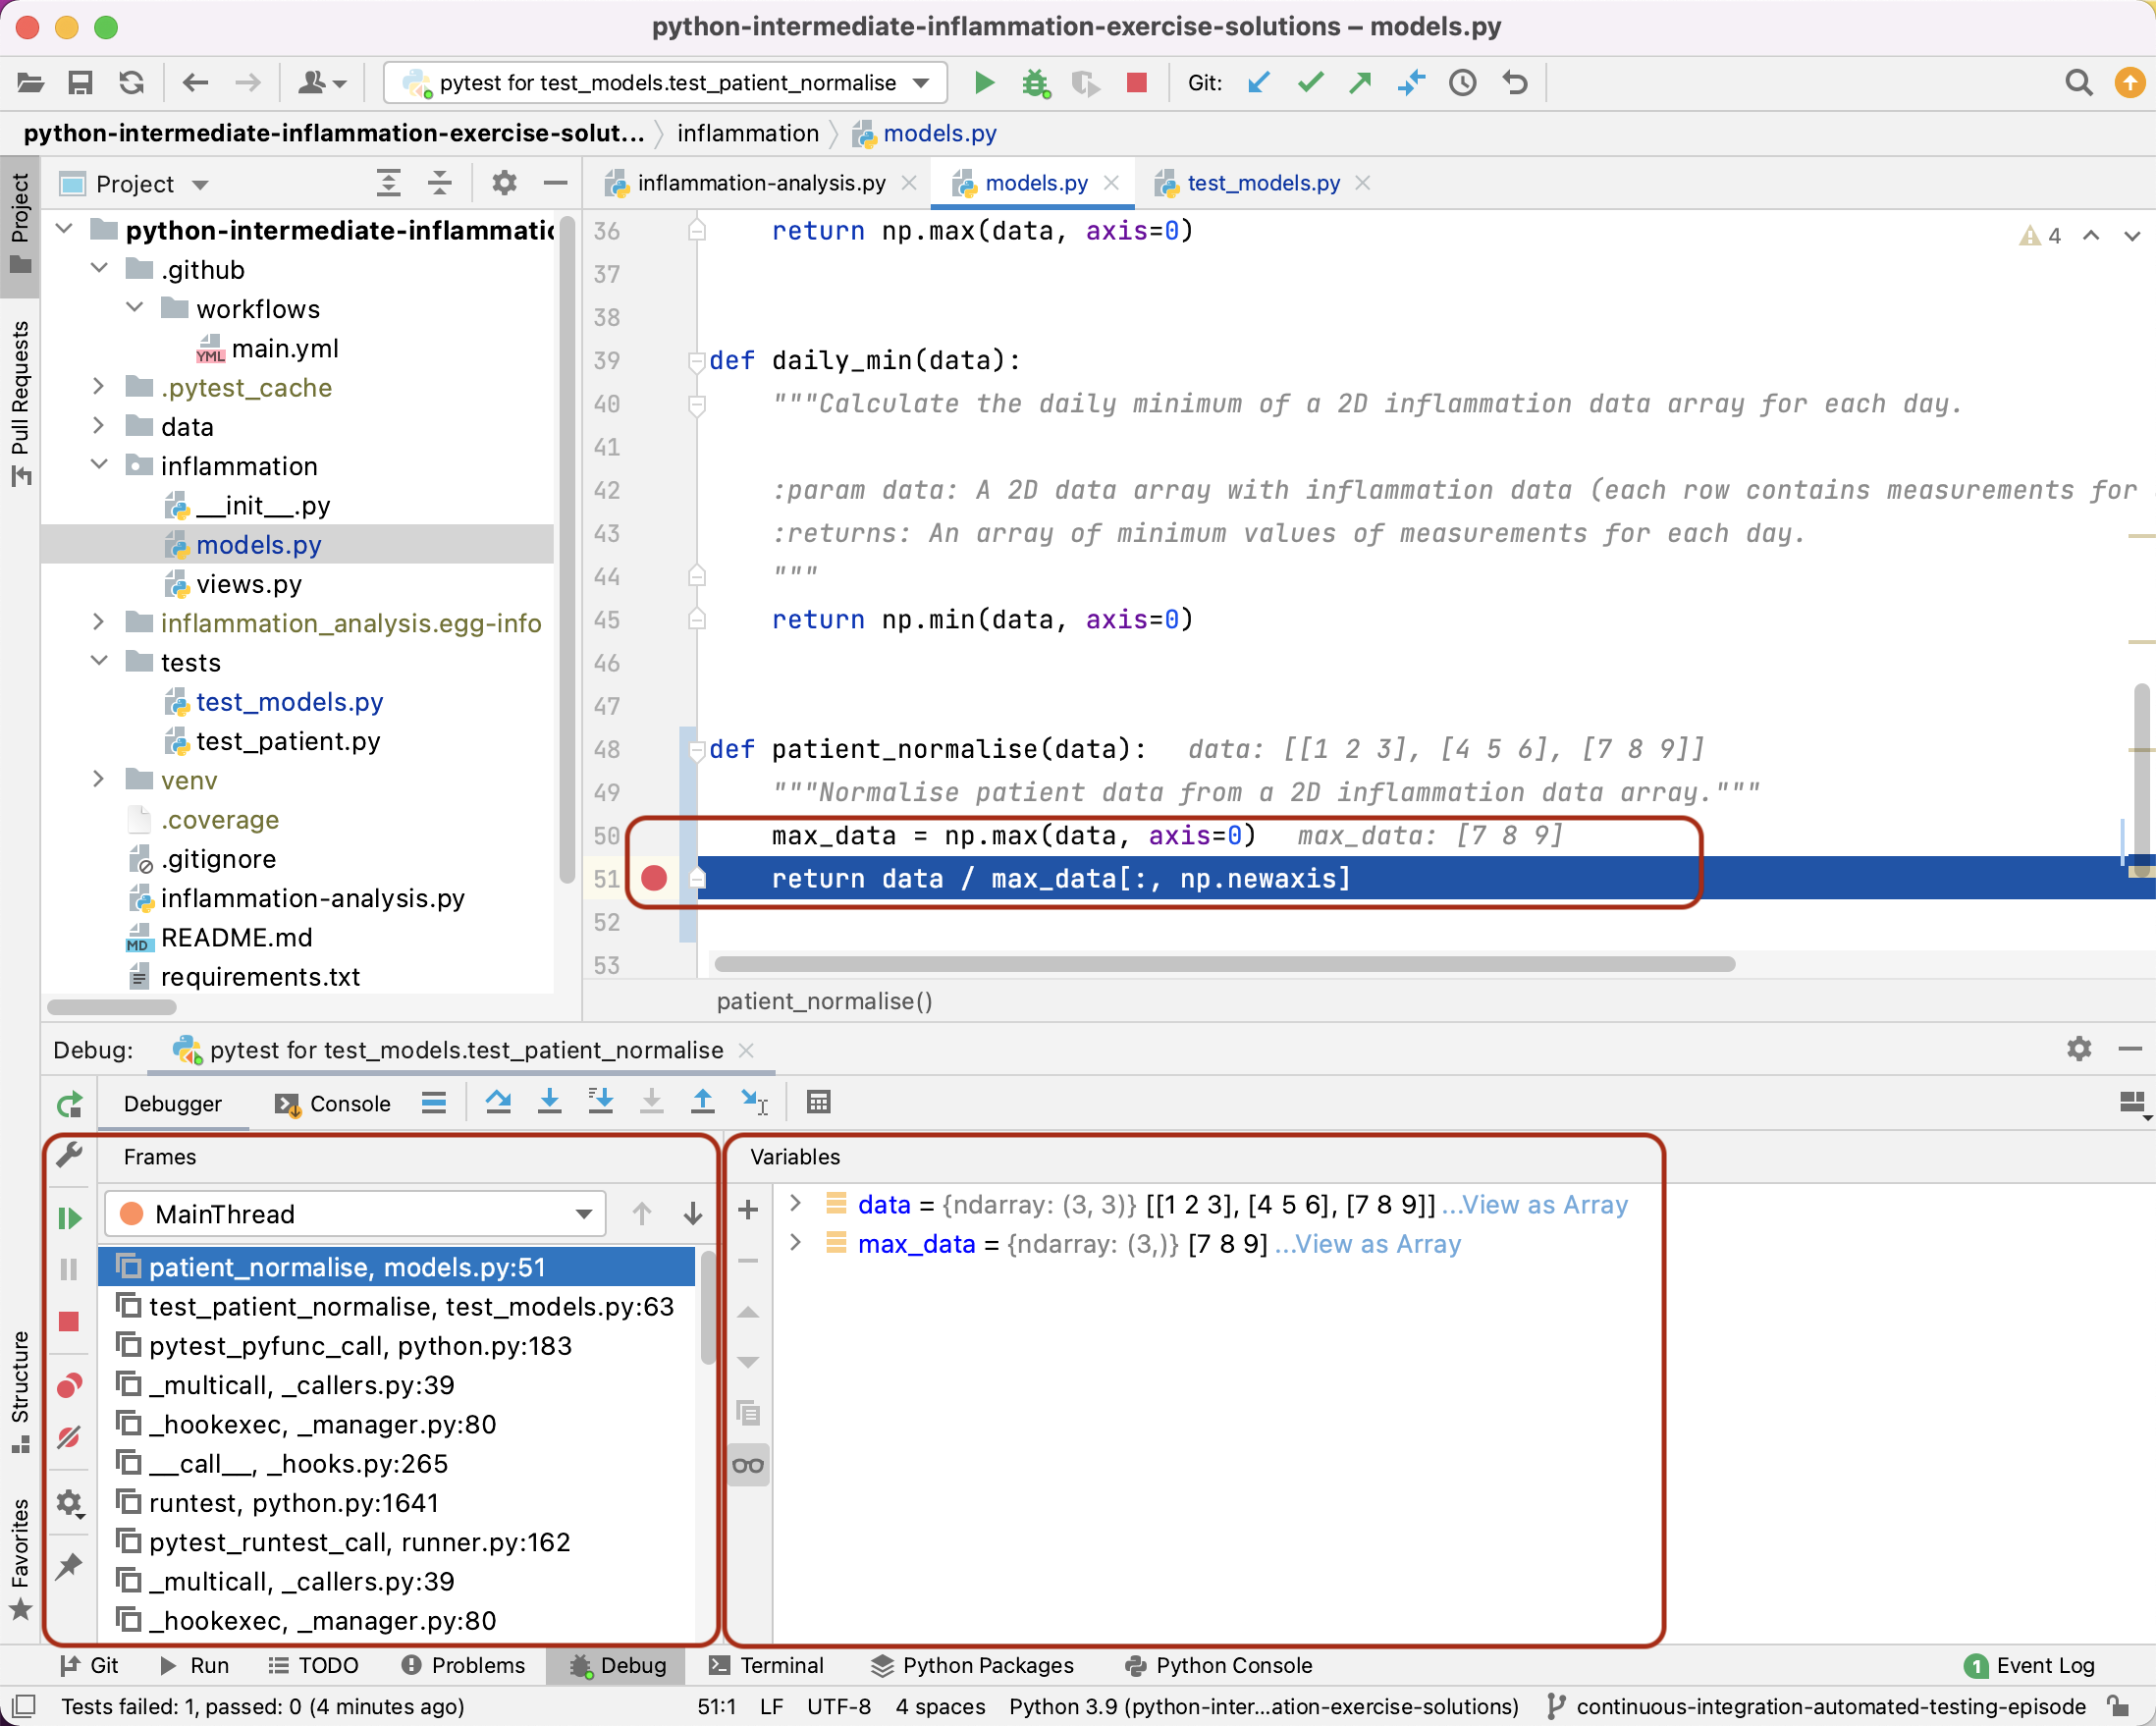
- The
Framessection on the left, which shows the call stack (the chain of functions that have been executed to lead to this point). We can traverse this chain of functions if we wish, to observe the state of each function. - The
Variablessection on the right, which displays the local and global variables currently in memory which we can select to observe their current state.
We can also continue execution of the program at this point, until another breakpoint is reached or the program ends, or even step through the code one statement at a time. This gives us very fine-grained control of our program, as we attempt to diagnose any problems, and is incredibly useful when we need to know precisely what is happening when faults appear.
Key Points
IDEs provide tools and features to help develop increasingly complex code.
Debuggers allow you to set breakpoints which pause running code so its state can be inspected.
A call stack is a chain of functions that have been executed prior to a certain point.