All Images
Introduction
Figure 1
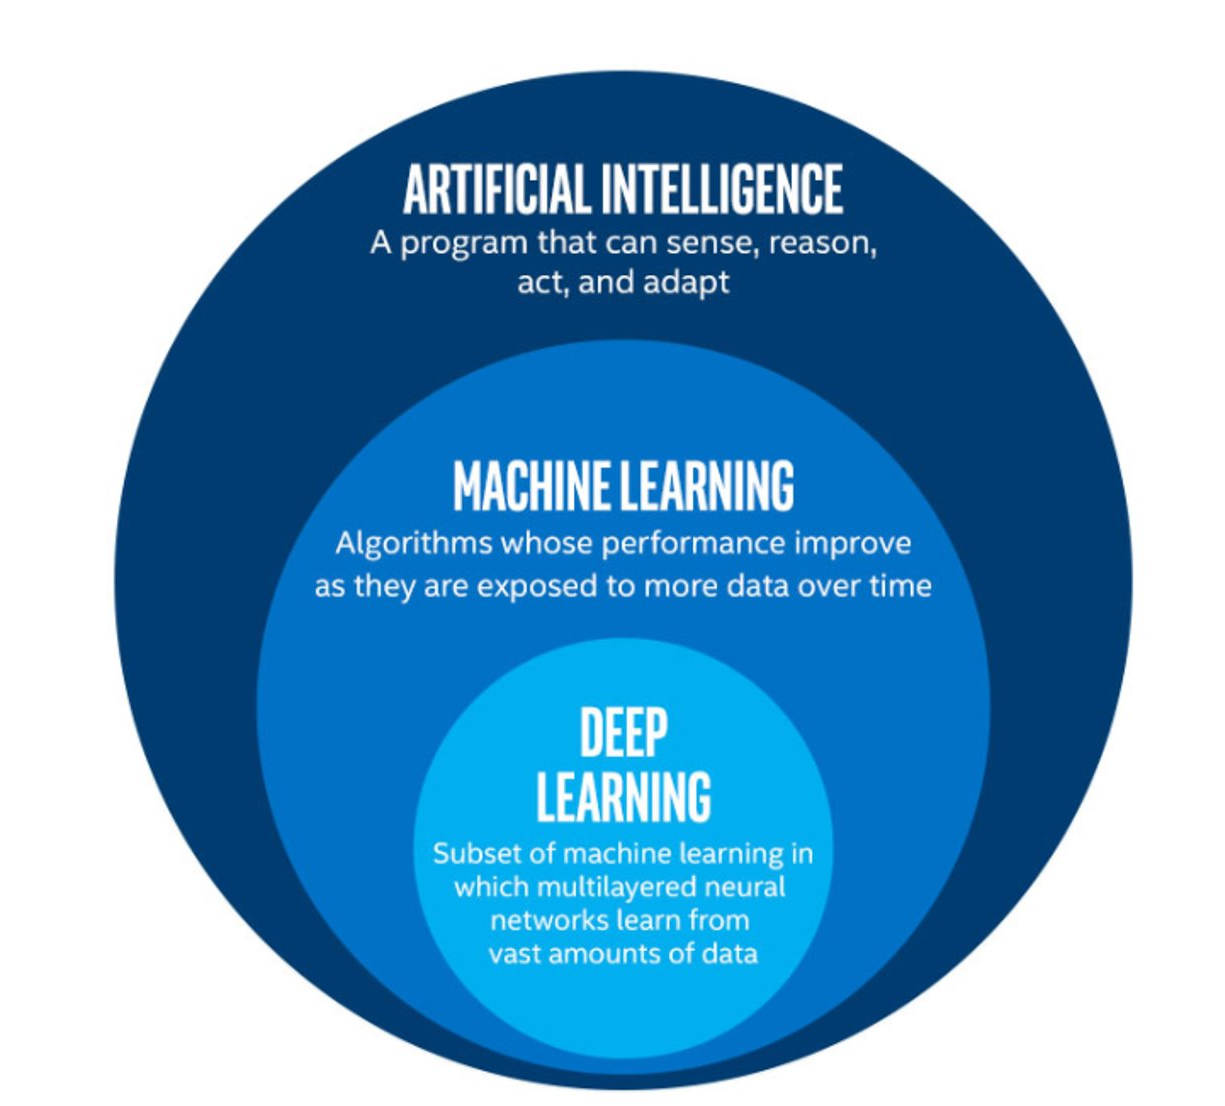
An infographic showing the relationships between
AI, ML, and DL
Figure 2
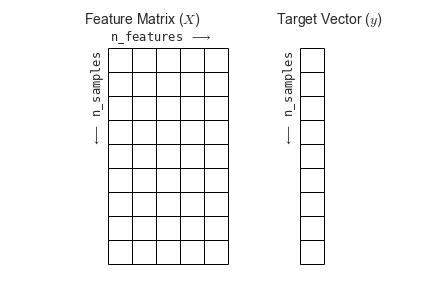
Types of Machine Learning
Figure 3
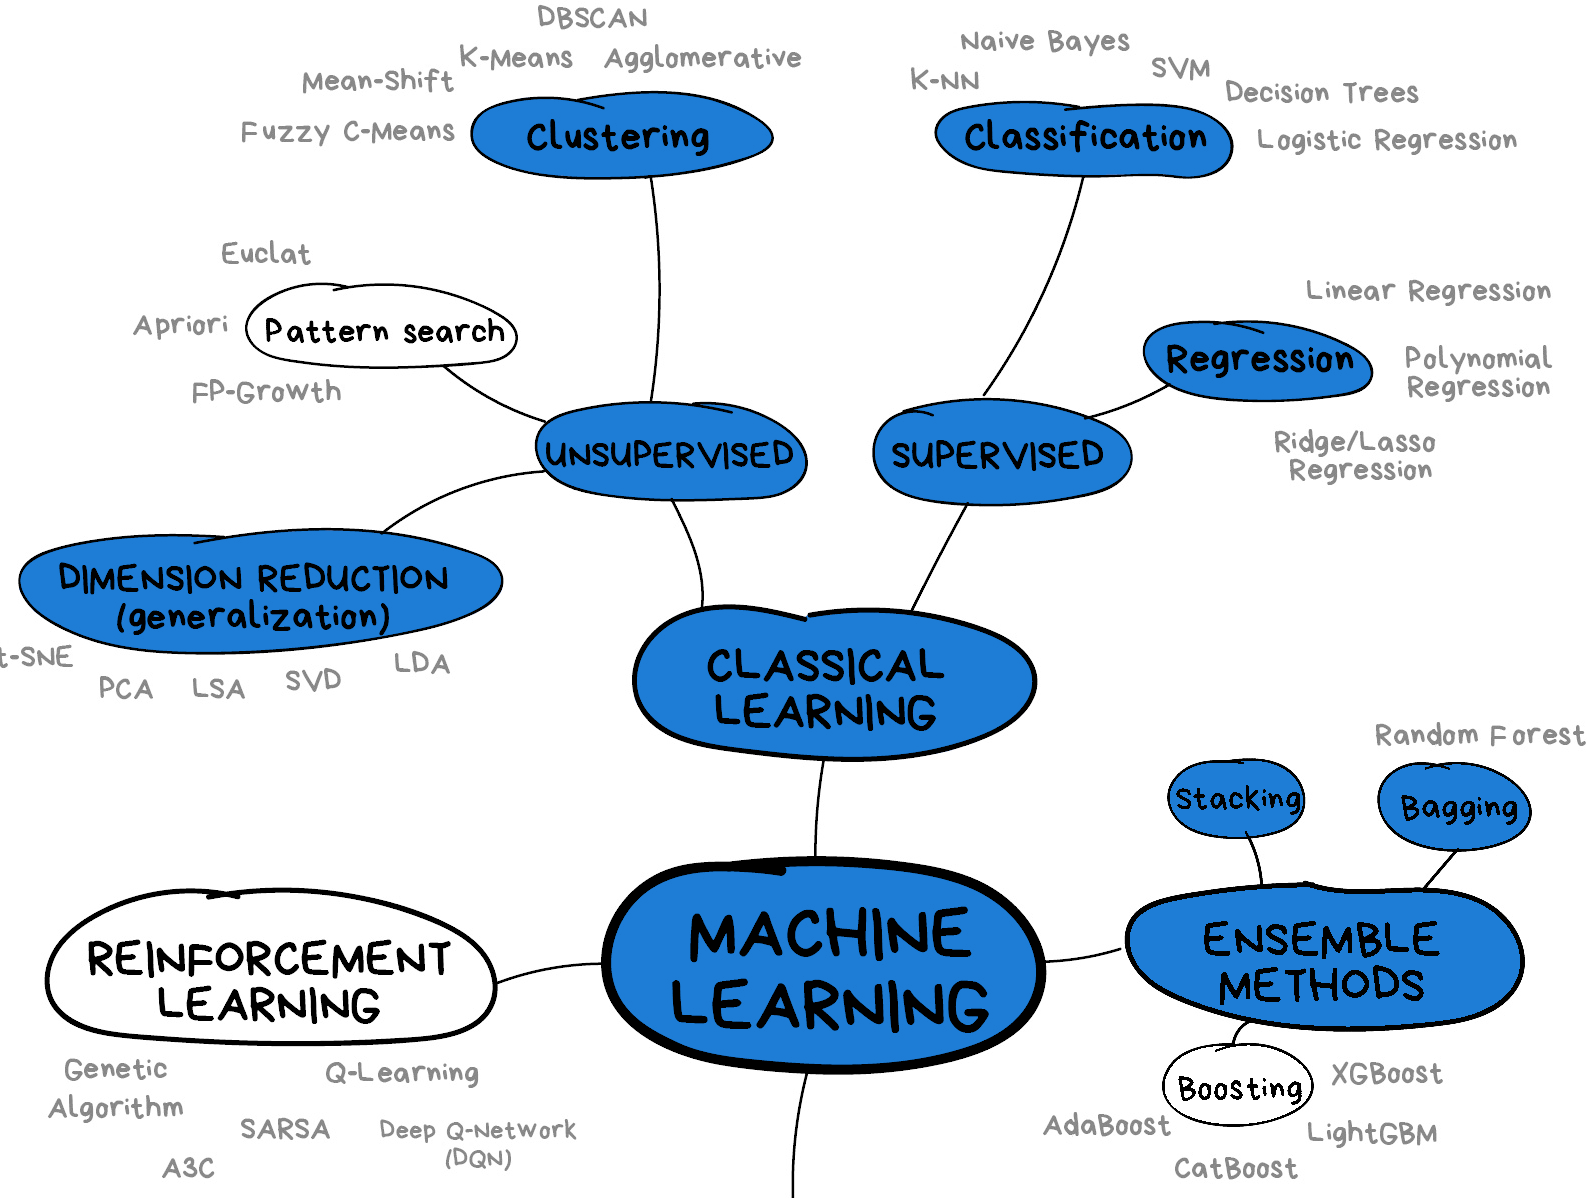
Summary of key concepts and sub-domains of
ML
Supervised methods - Regression
Figure 1
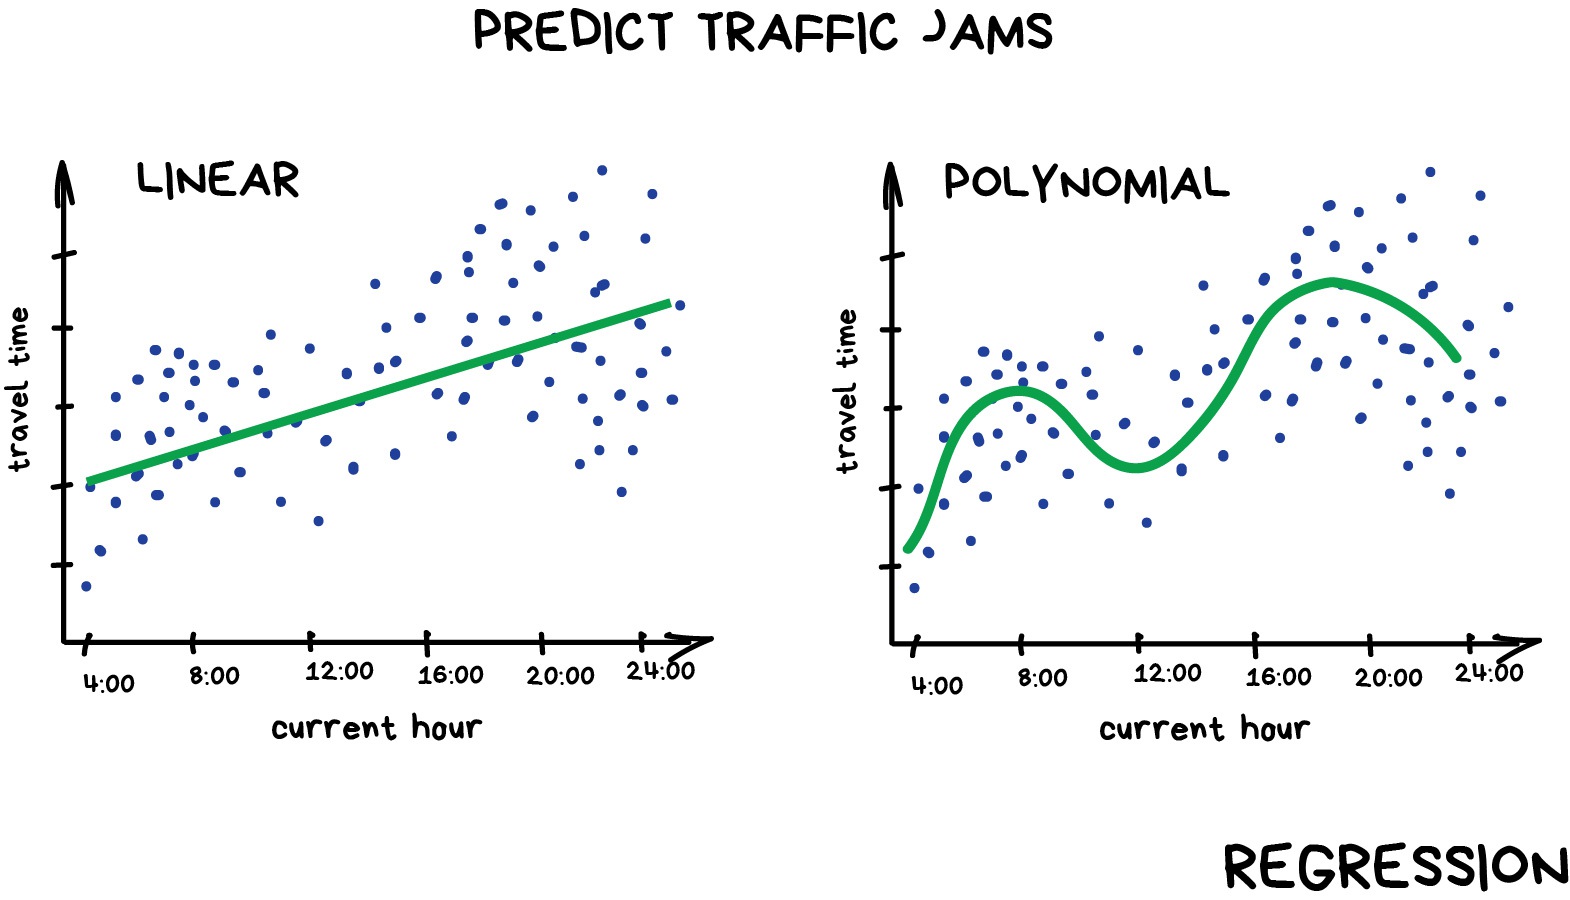
Example of linear and polynomial
regressions
Figure 2

Inspection of our dataset
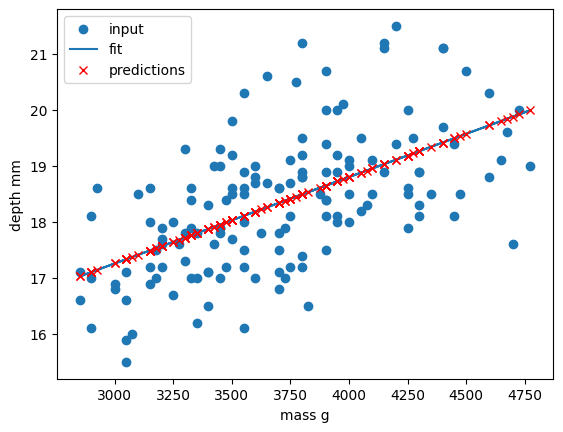
Figure 3
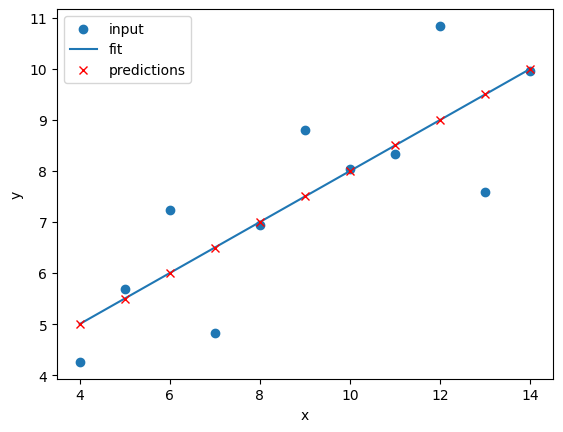
Linear regression of dataset I
Figure 4
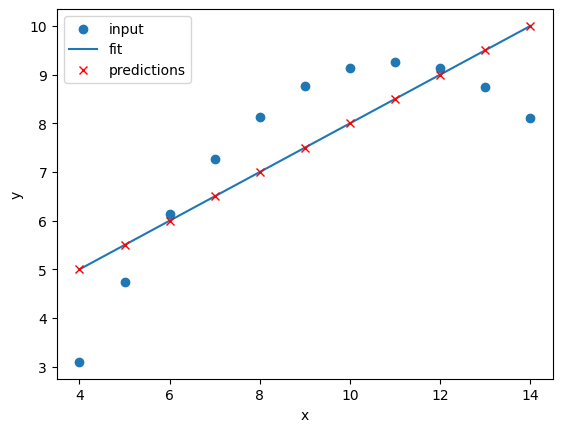
Linear regression of dataset II
Figure 5
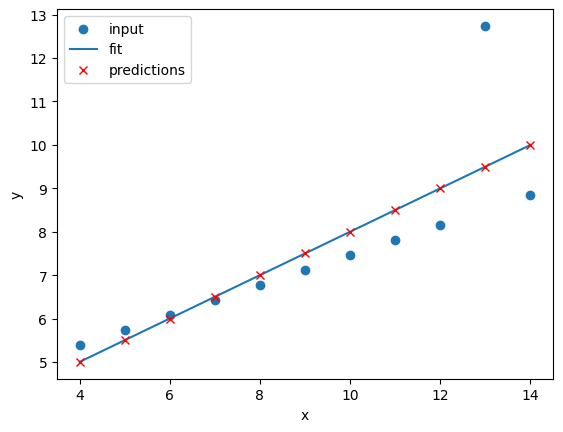
Linear regression of dataset III
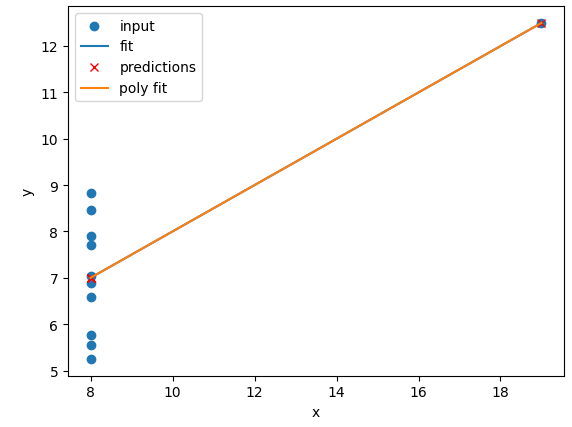
Figure 6
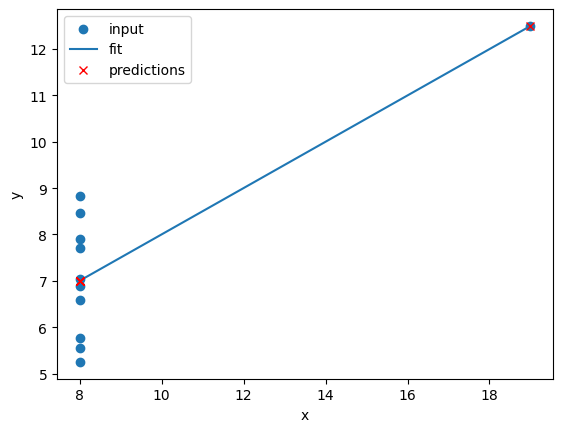
Linear regression of dataset IV
Figure 7
Comparison of the regressions of our
dataset
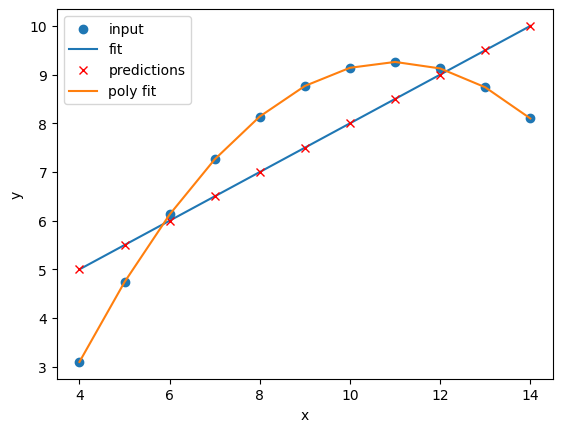
Figure 8
Polynomial regression of dataset I
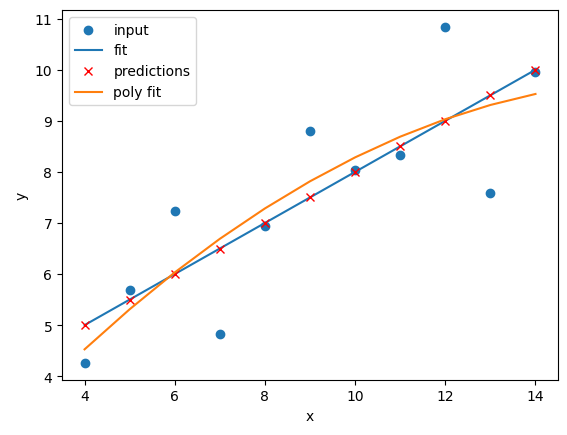
Figure 9
Polynomial regression of dataset II
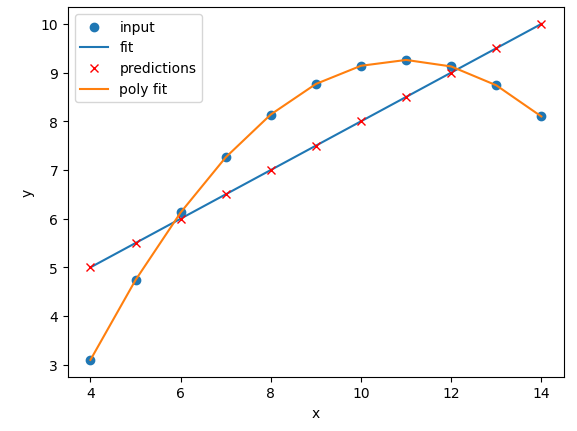
Figure 10
Polynomial regression of dataset III
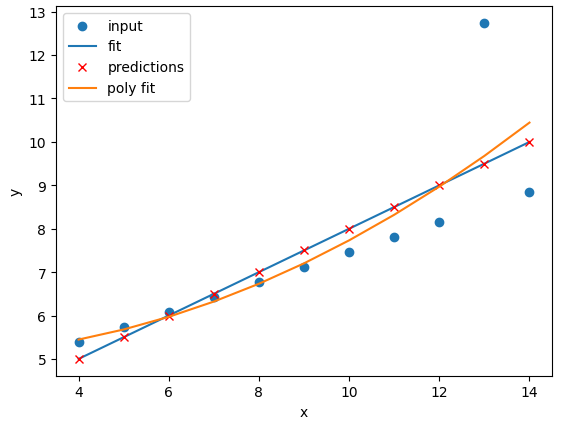
Figure 11
Polynomial regression of dataset IV
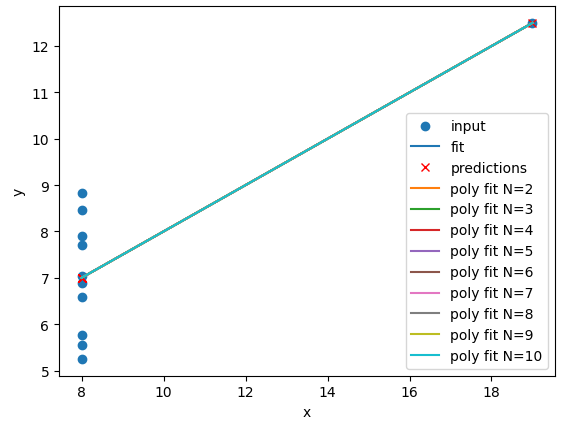
Figure 12
Polynomial regression of dataset I with N
between 1 and 10
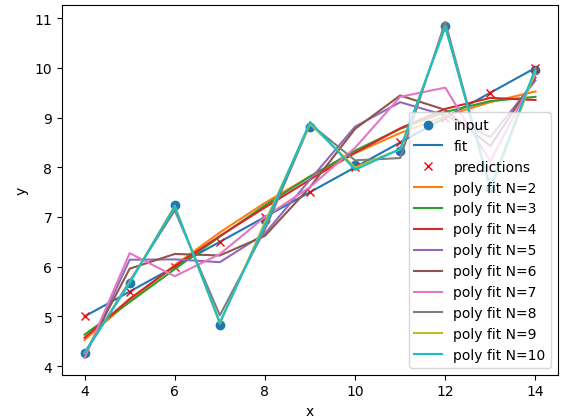
Figure 13
Polynomial regression of dataset II with N
between 1 and 10
Figure 14
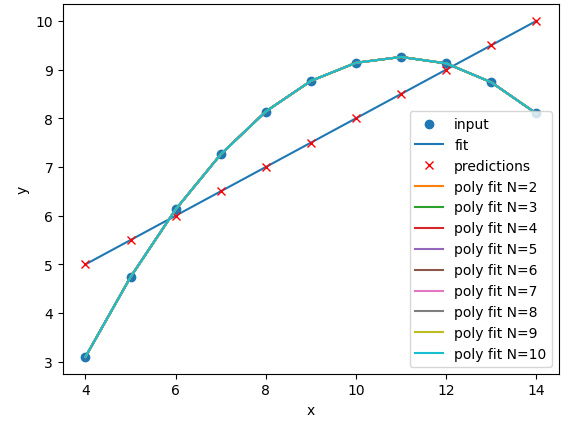
Polynomial regression of dataset III with N
between 1 and 10
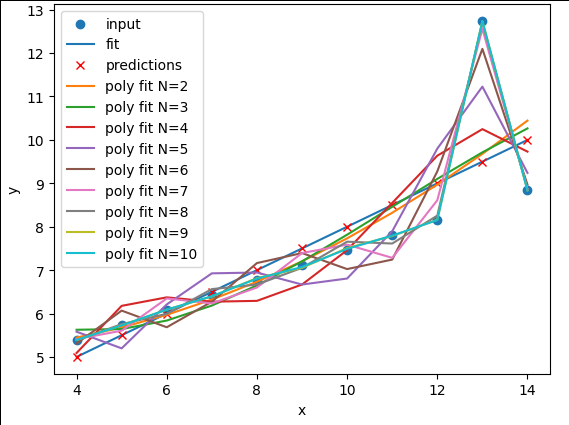
Figure 15
Polynomial regression of dataset IV with N
between 1 and 10
Figure 16
Comparison of the regressions of our
dataset
Figure 17
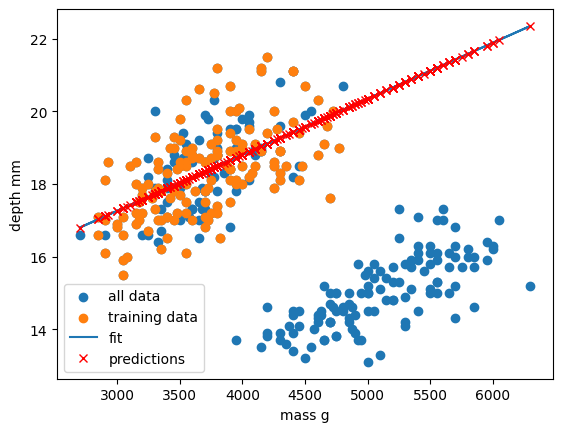
Comparison of the regressions of our
dataset
Supervised methods - classification
Figure 1
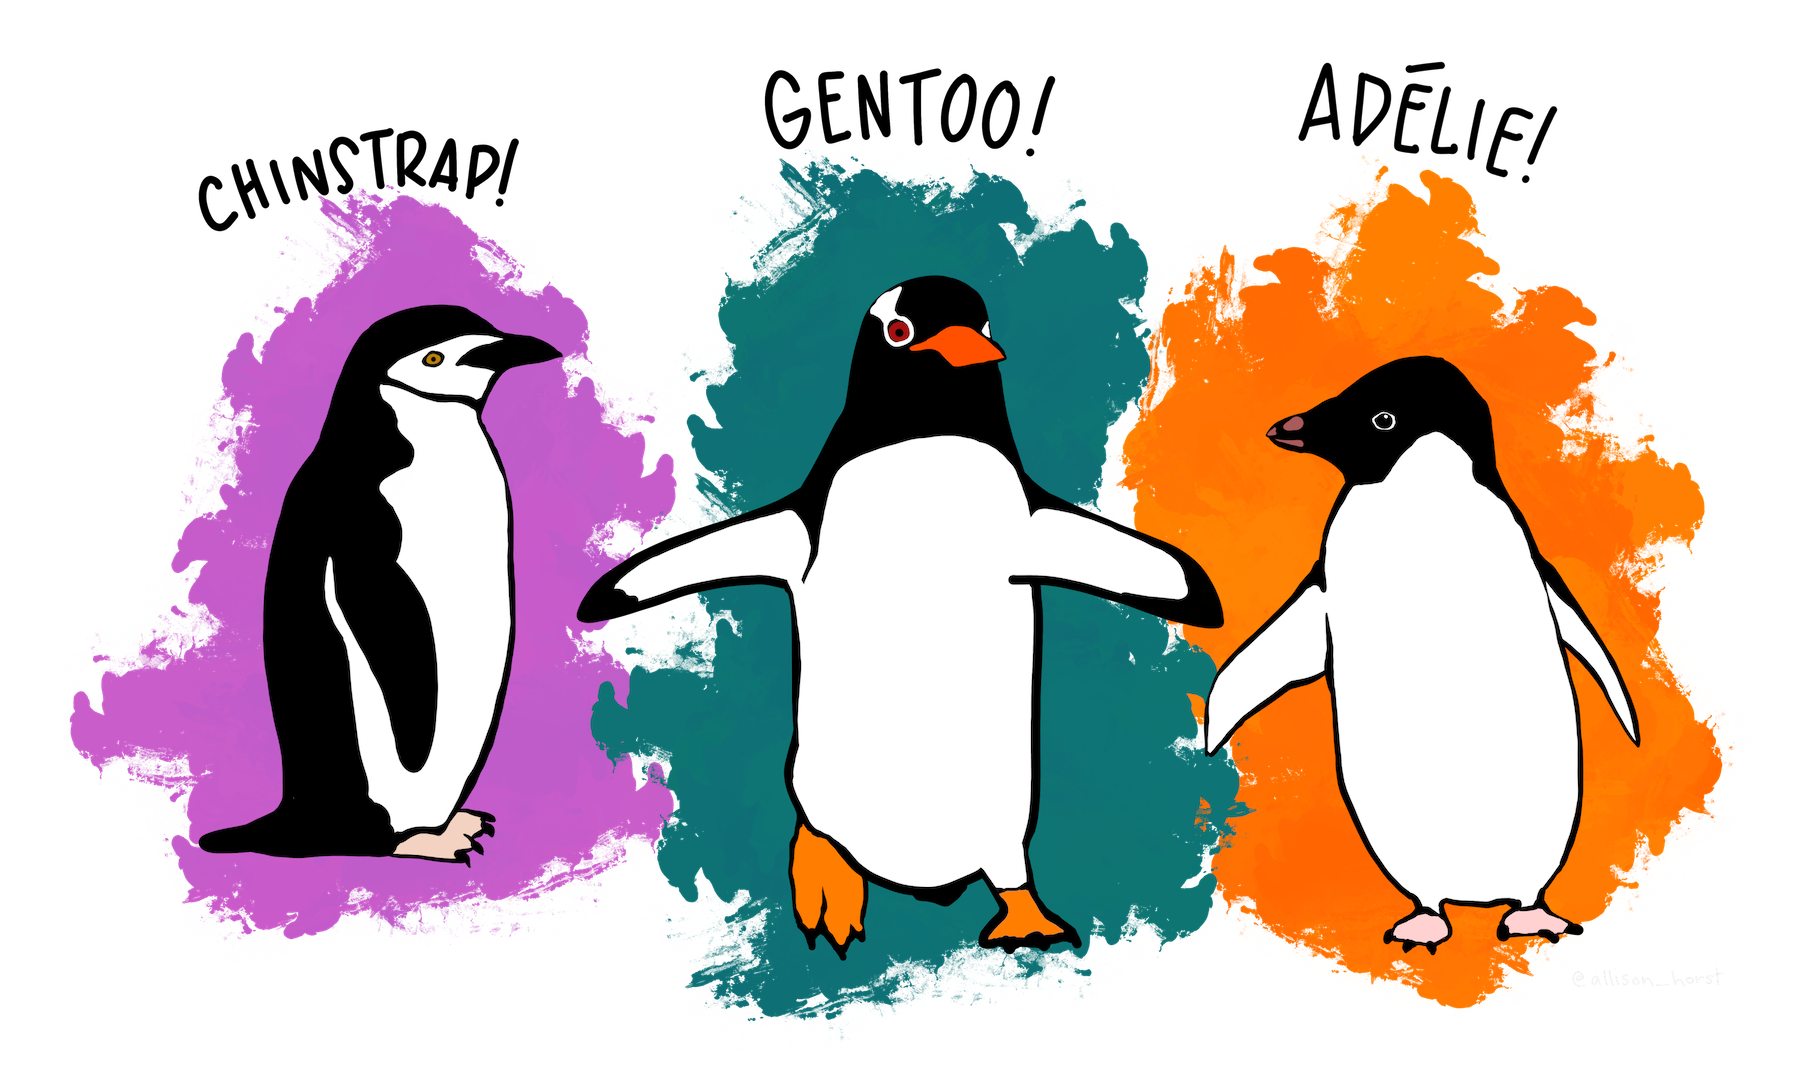
Artwork by @allison_horst
Figure 2
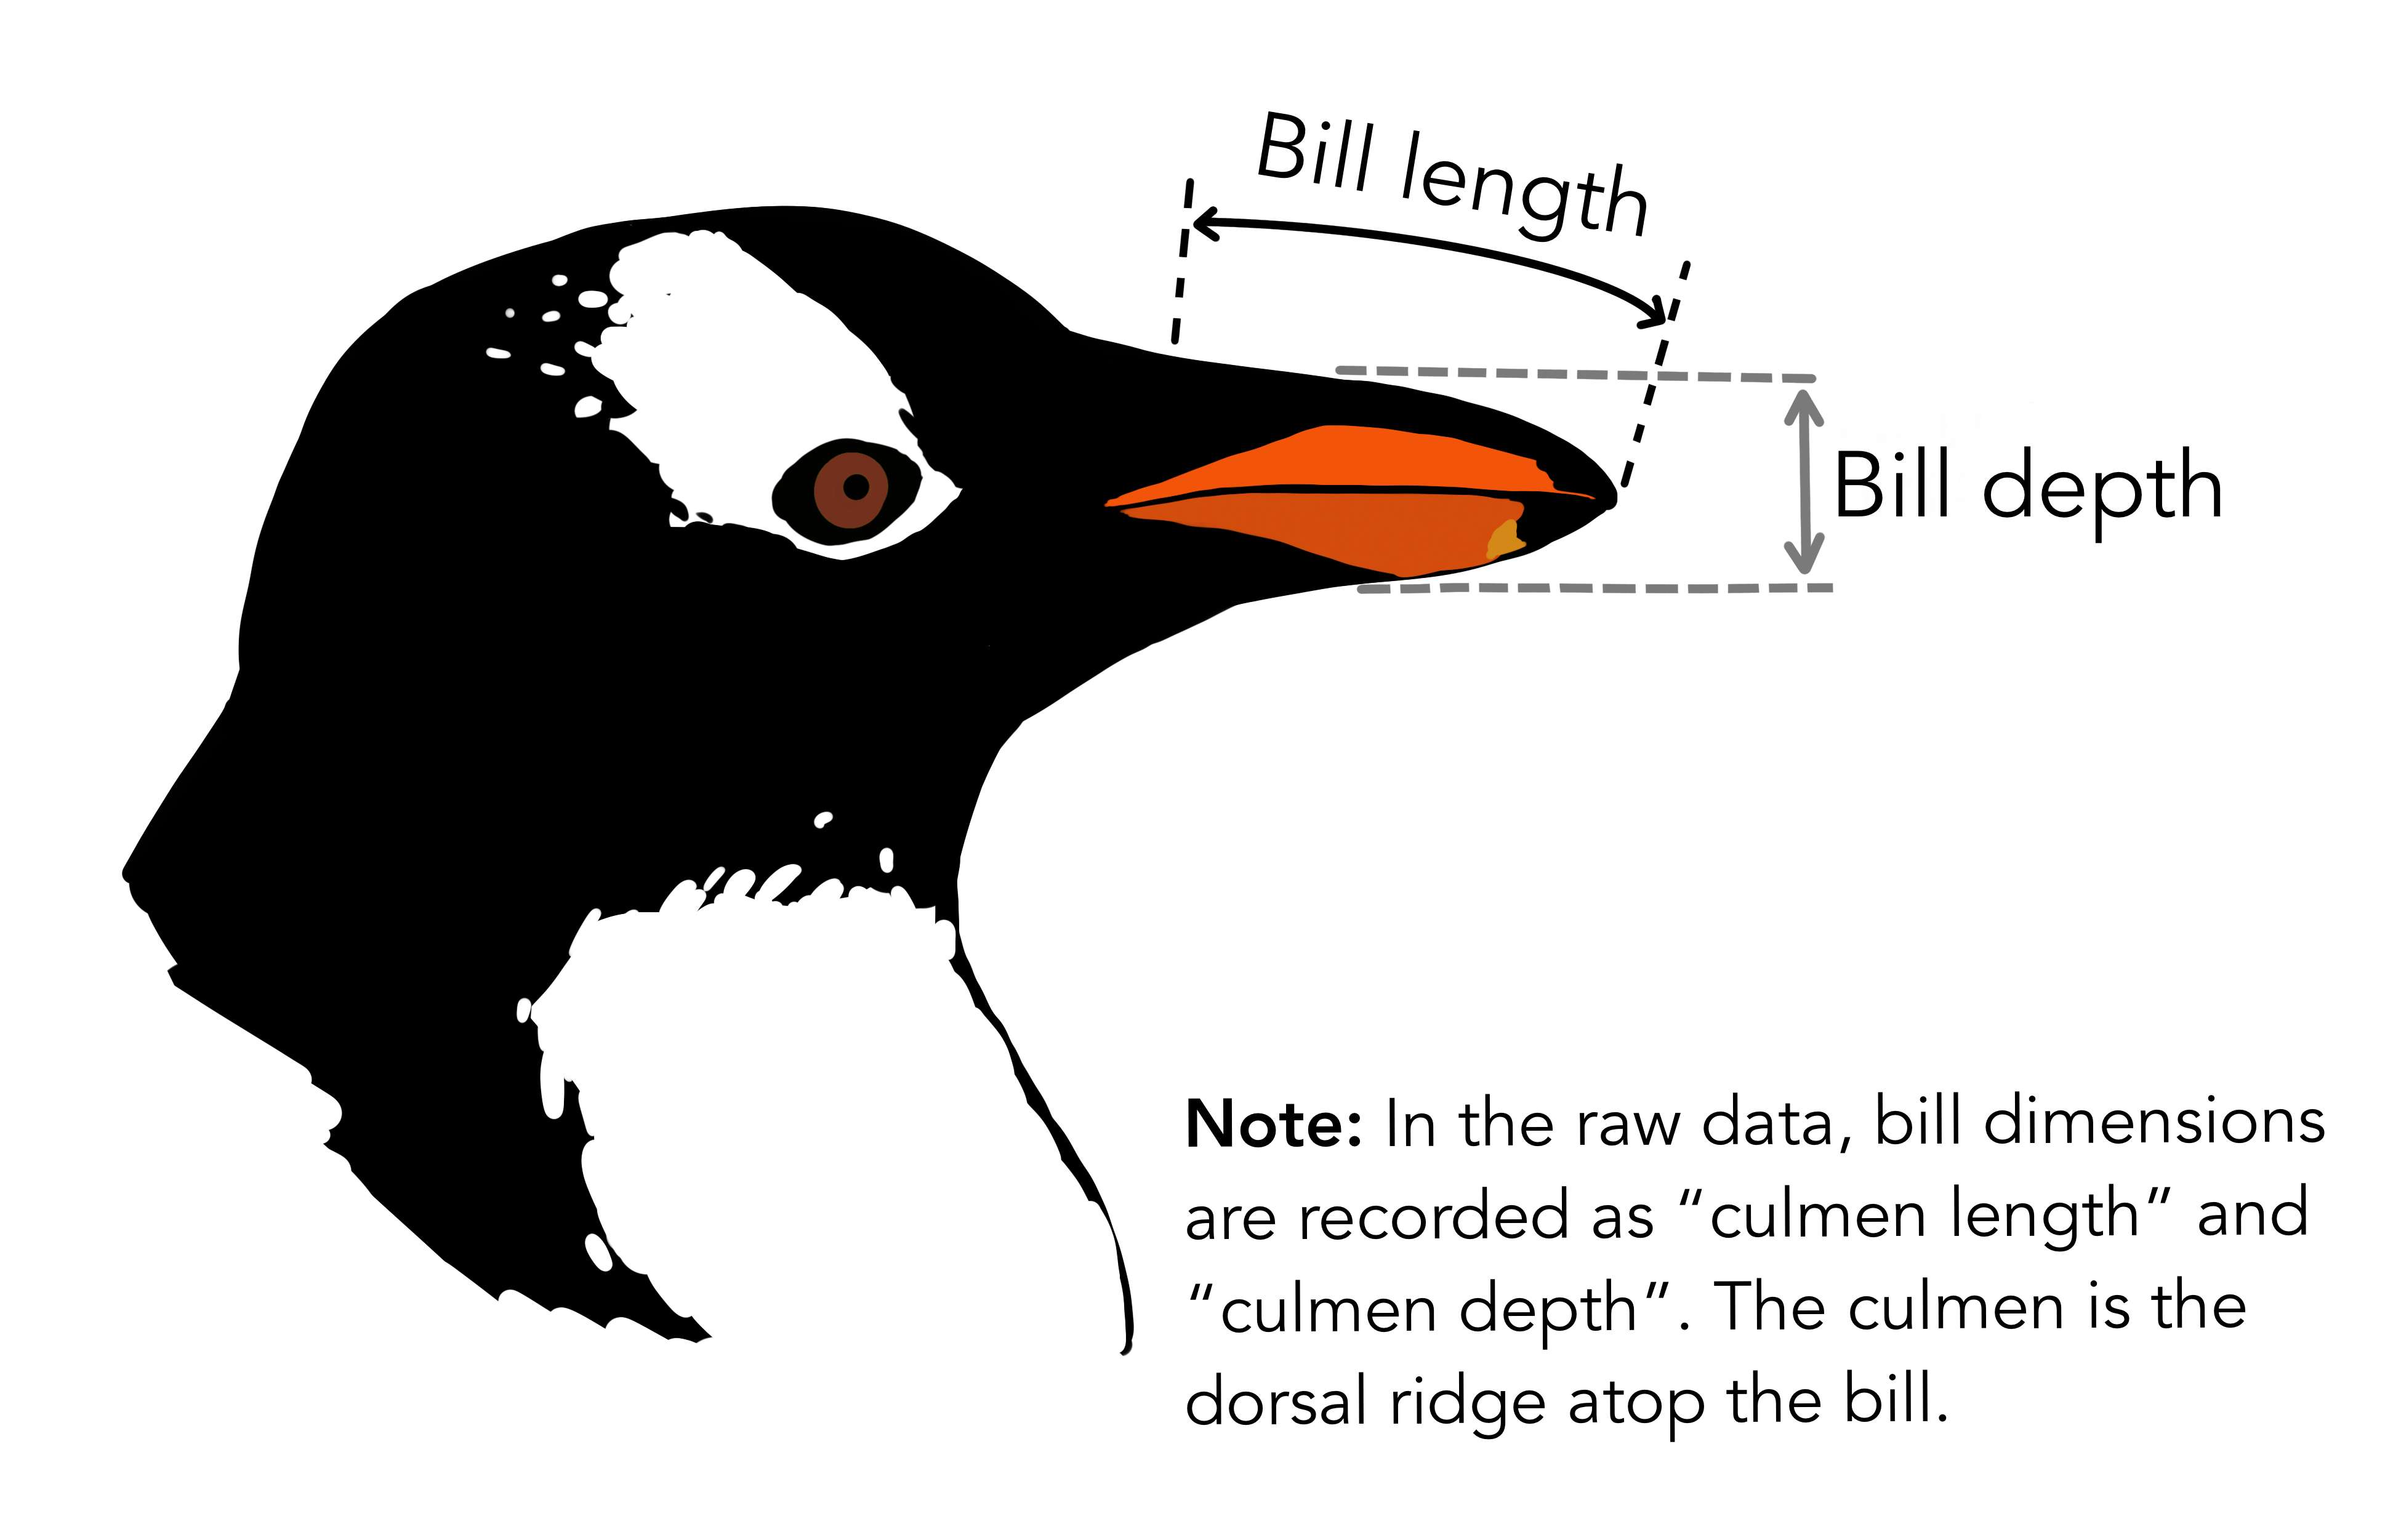
Artwork by @allison_horst
Figure 3
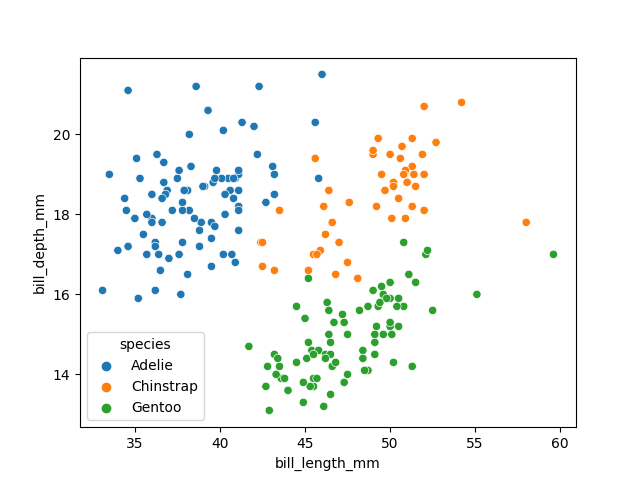
Visualising the penguins dataset
Figure 4
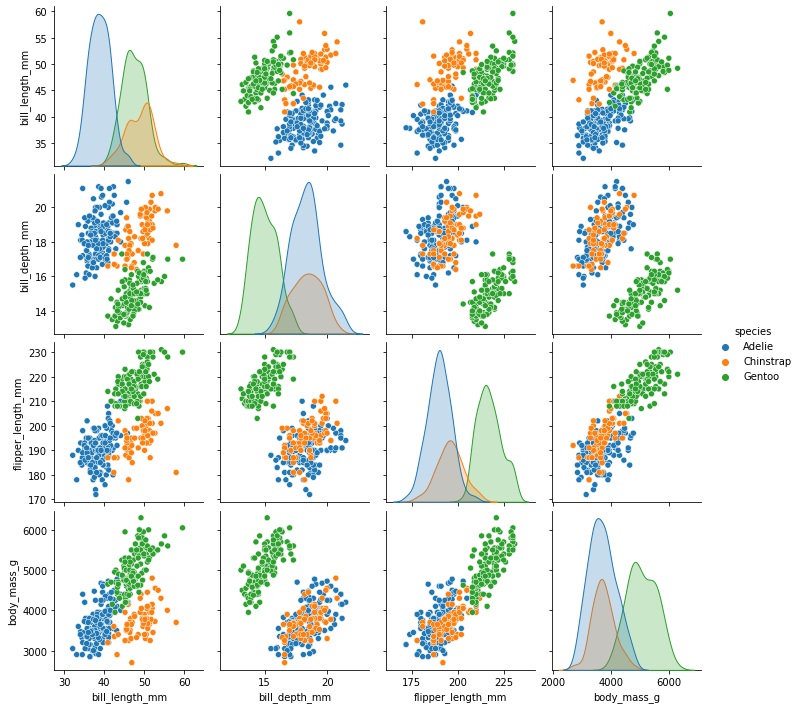
Visualising the penguins dataset
Figure 5
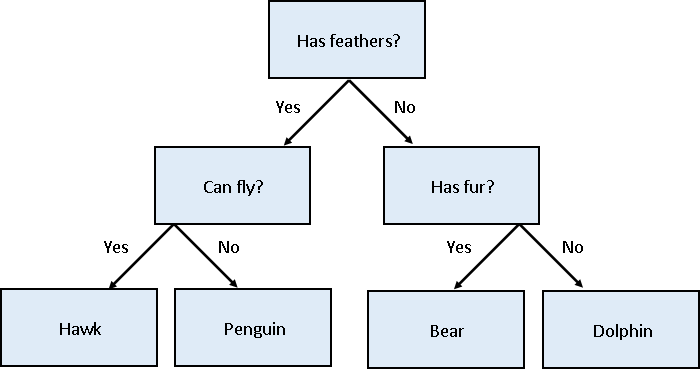
Decision tree for classifying penguins
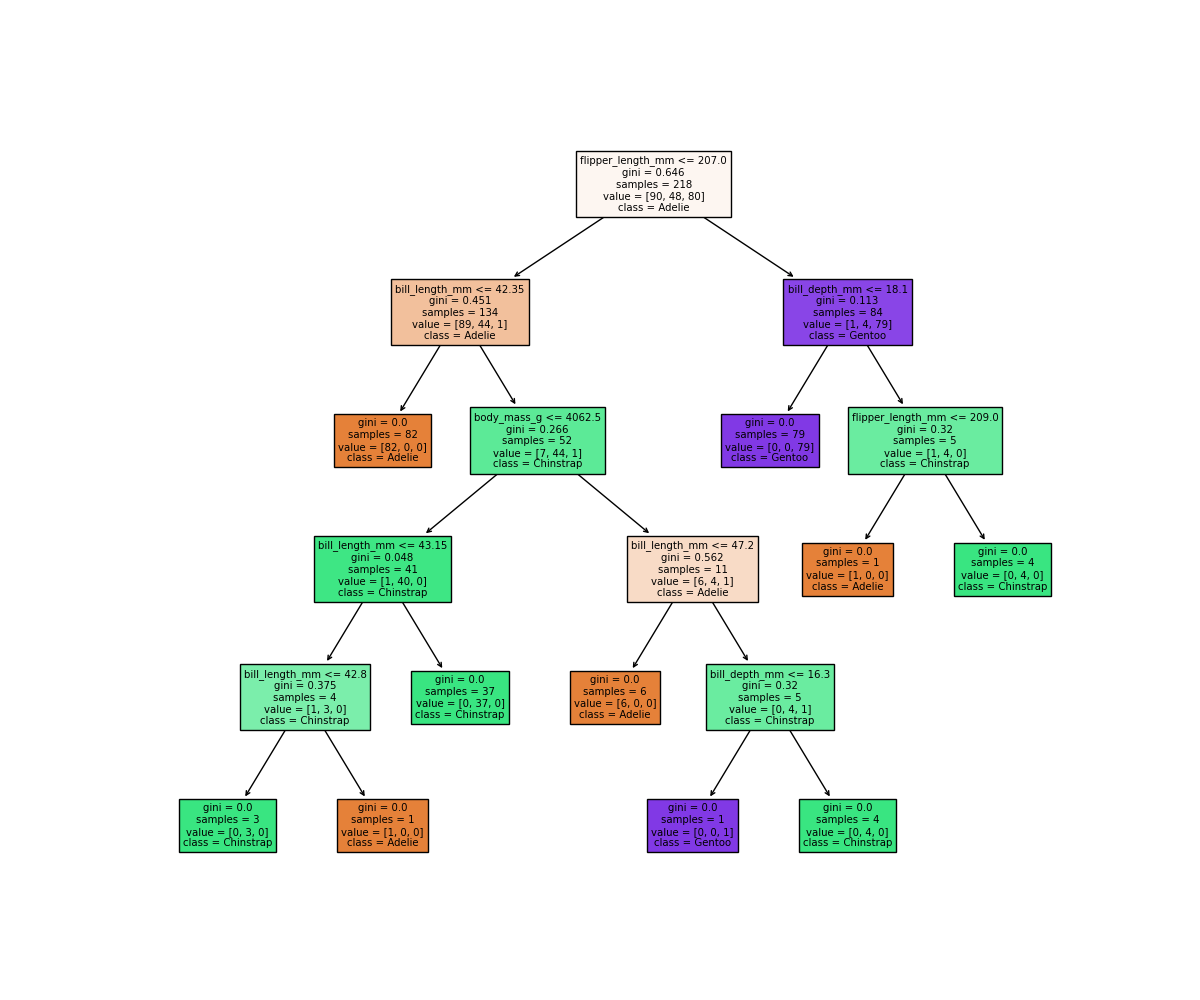
Figure 6
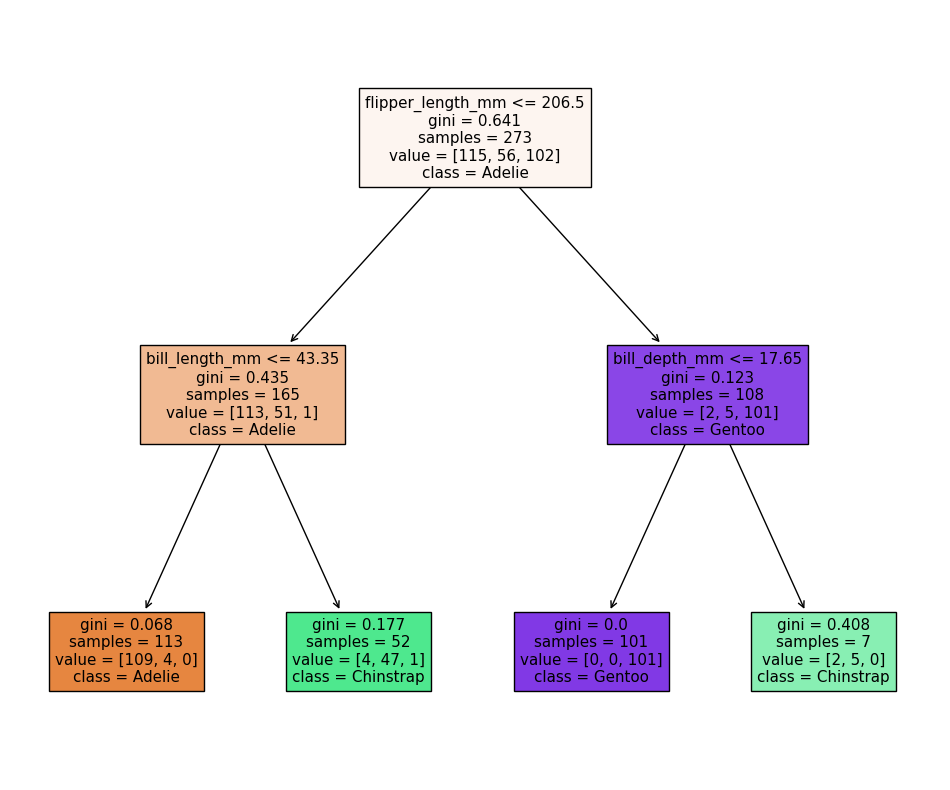
Decision tree for classifying penguins
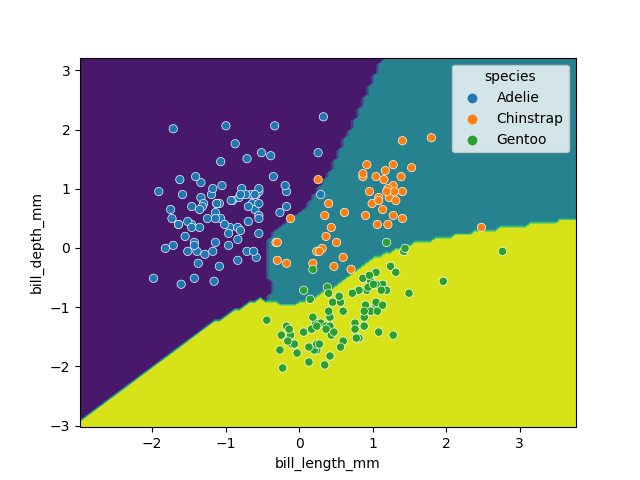
Figure 7
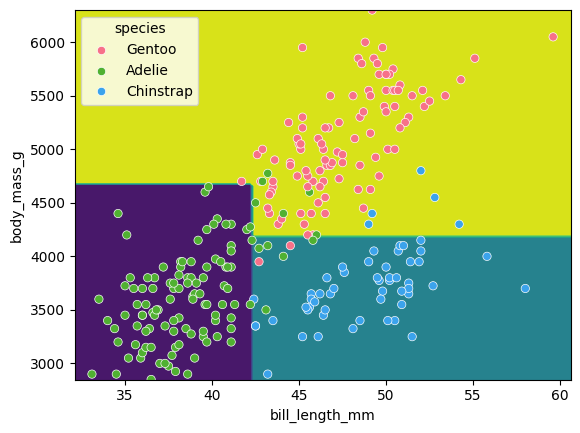
Classification space for our decision tree
Figure 8
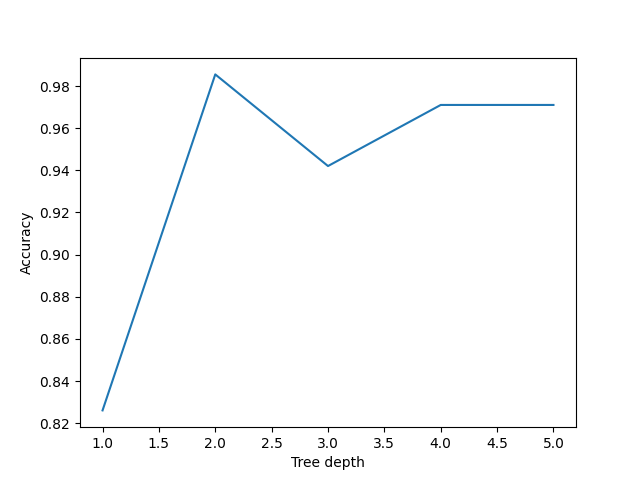
Performance of decision trees of various
depths
Figure 9
Simplified decision tree
Figure 10
Classification space of the simplified decision
tree
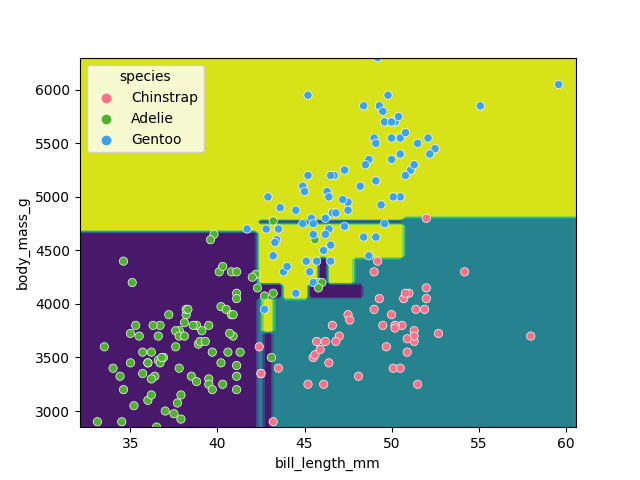
Figure 11
Classification space generated by the SVM
model
Ensemble Methods
Figure 1
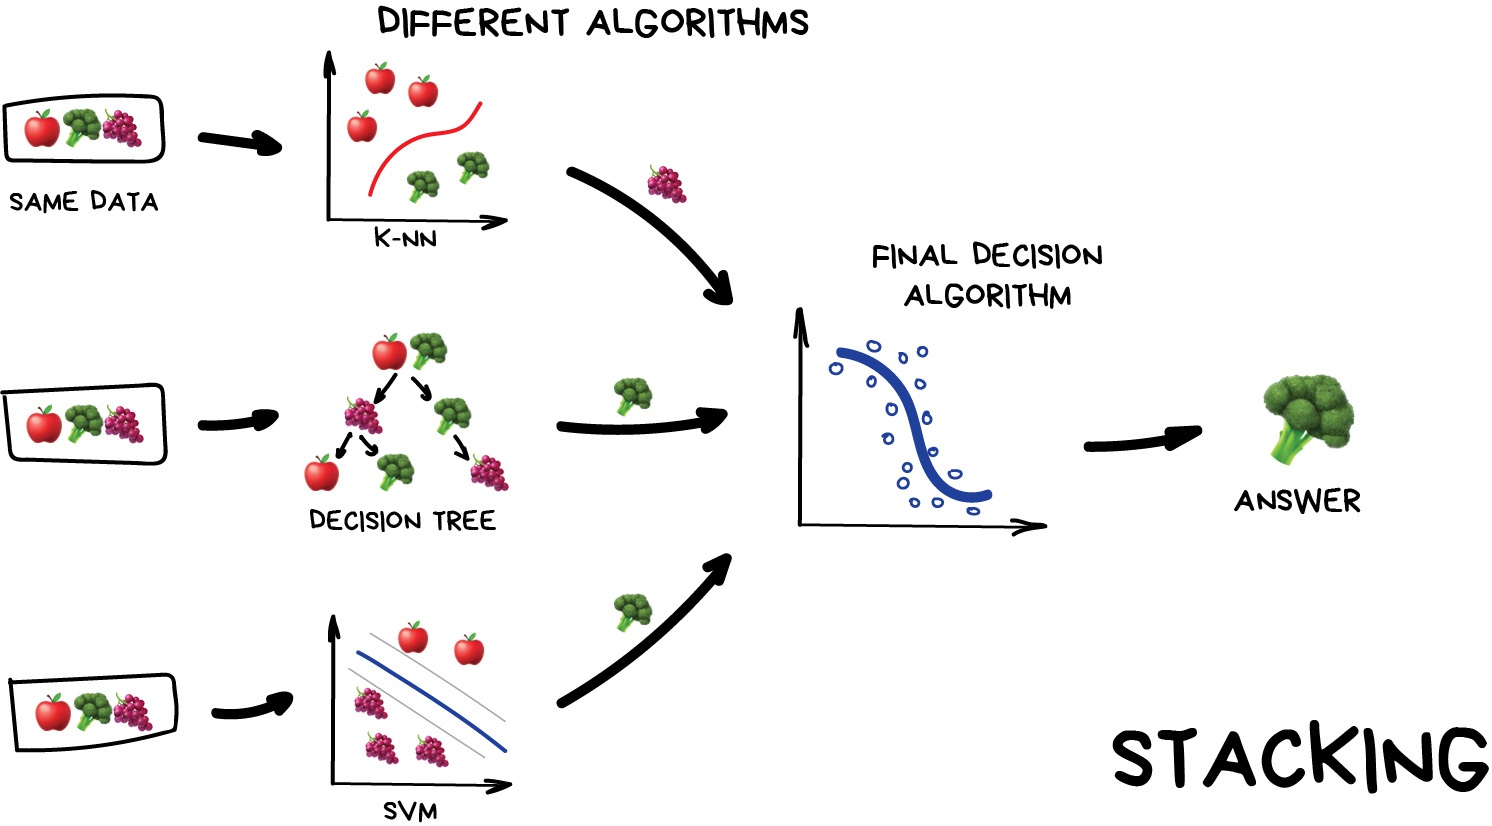
Stacking
Figure 2
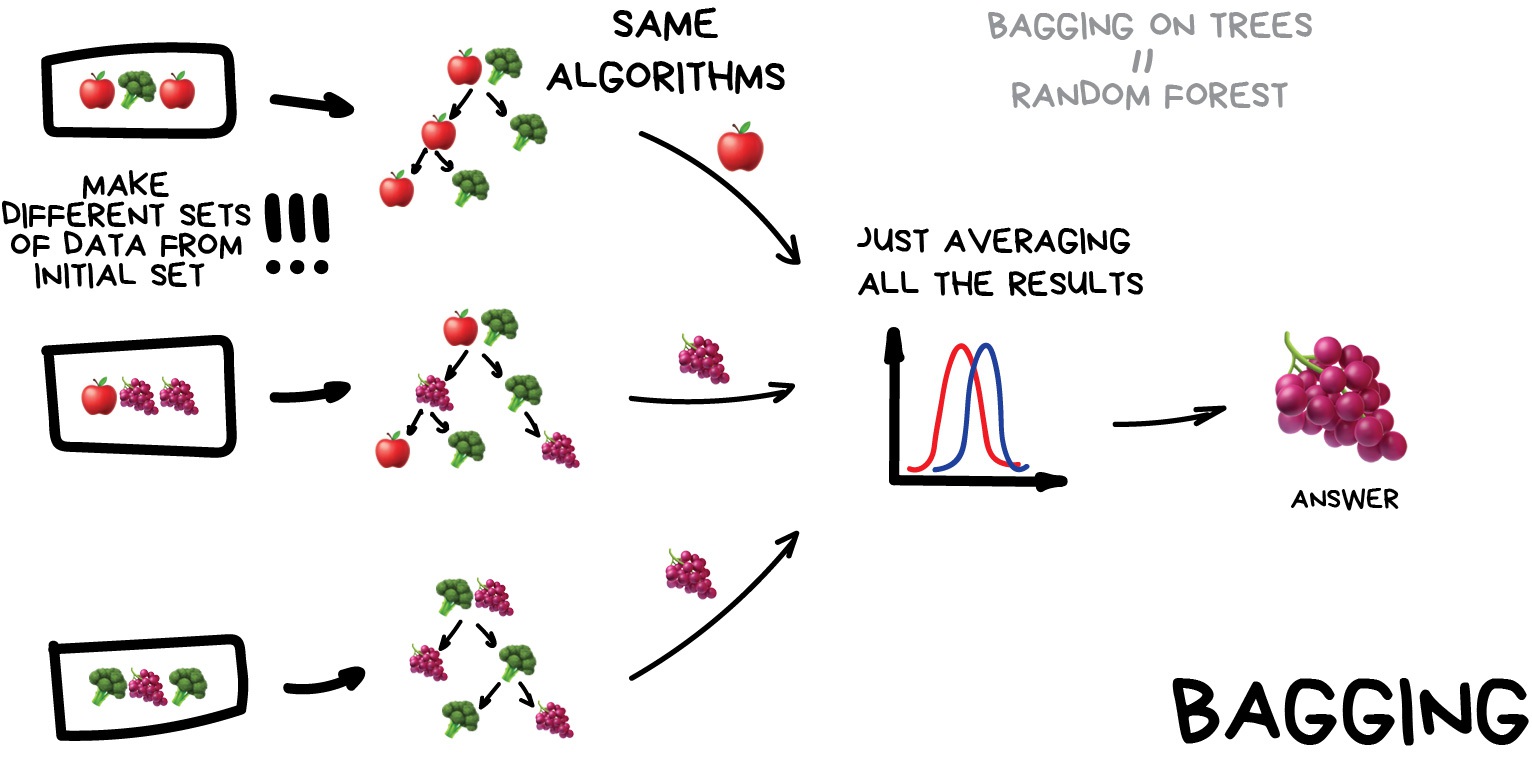
Bagging
Figure 3
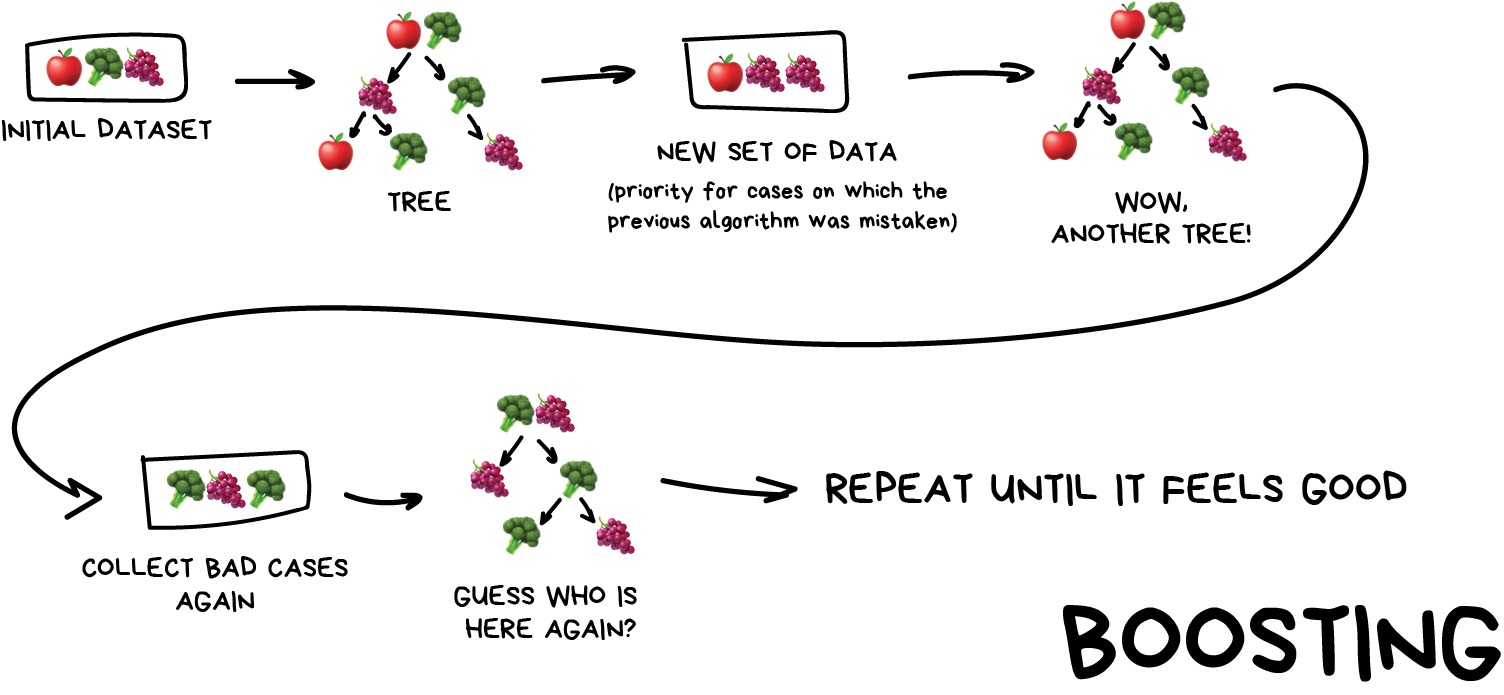
Boosting
Figure 4
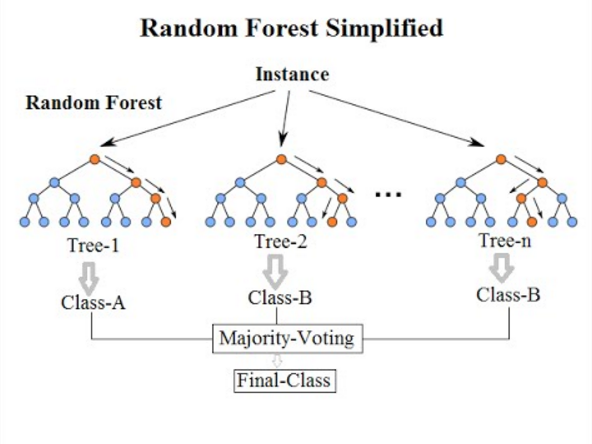
Random Forests
Figure 5
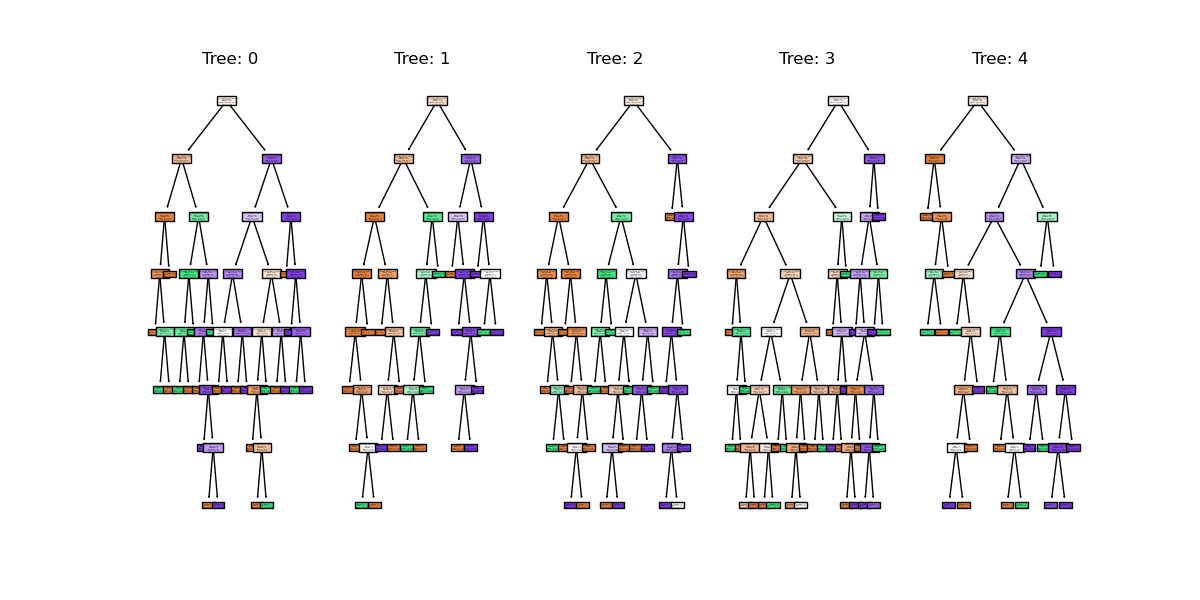
Random forest trees
Figure 6
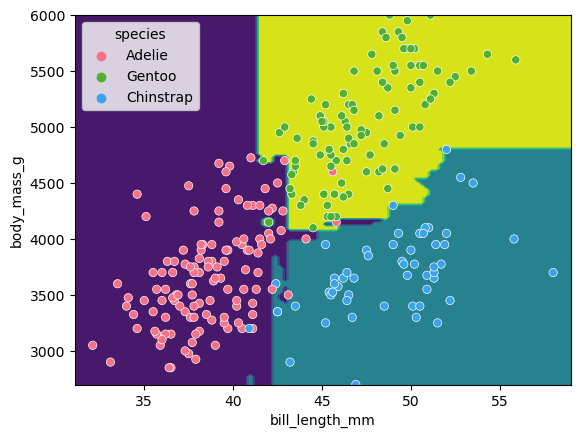
Random forest clf space
Figure 7

Regressor predictions and average from
stack
Unsupervised methods - Clustering
Figure 1
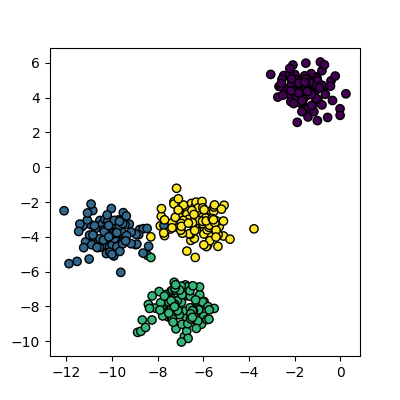
Plot of the random clusters
Figure 2
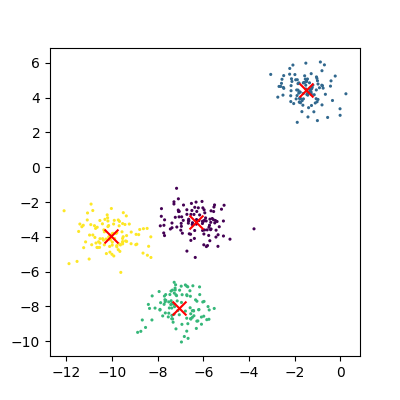
Plot of the fitted random clusters
Figure 3
An example of kmeans failing on non-linear
cluster boundaries
Figure 4
Kmeans attempting to classify overlapping
clusters
Figure 5
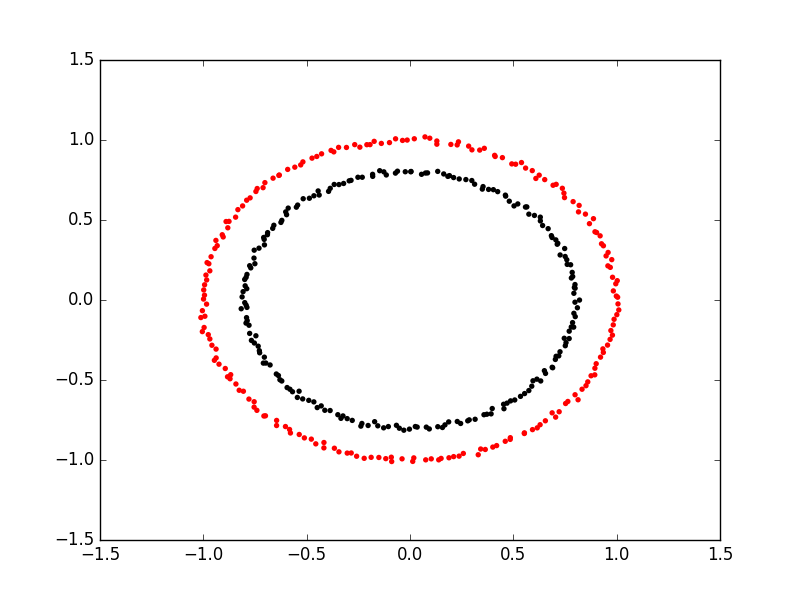
Spectral clustering on two concentric
circles
Figure 6
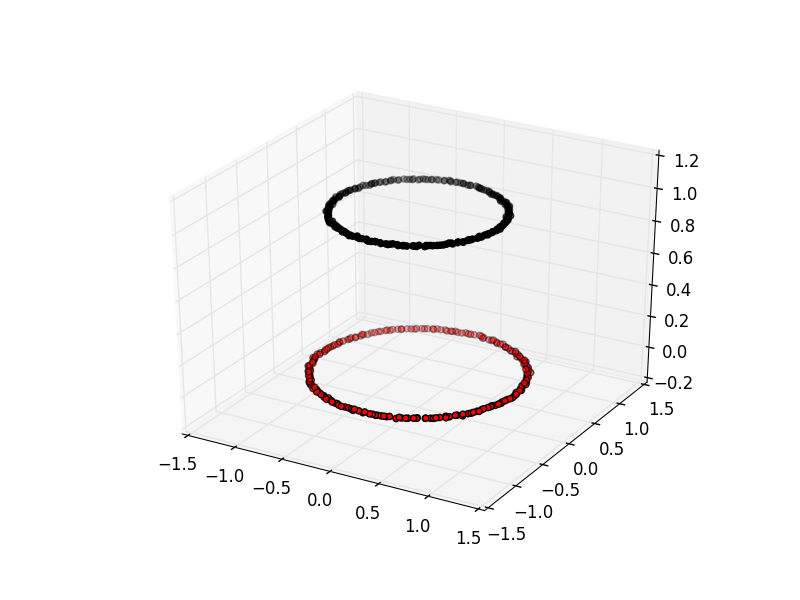
Spectral clustering viewed with an extra
dimension
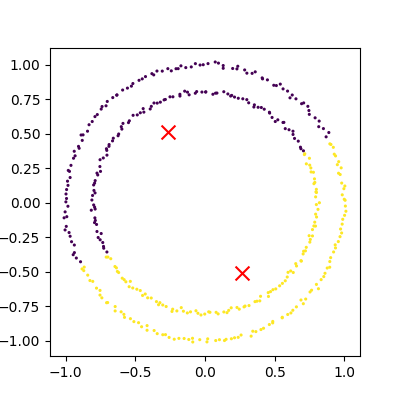
Figure 7
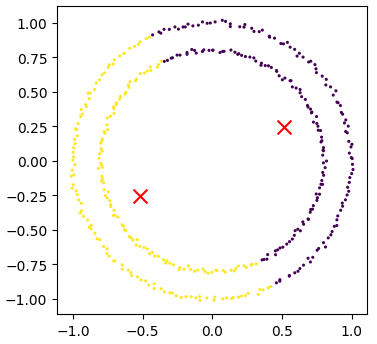
Kmeans attempting to cluster the concentric
circles
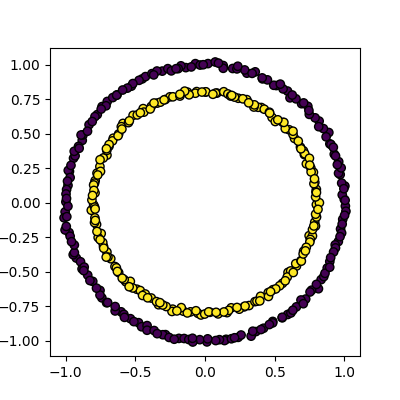
Figure 8
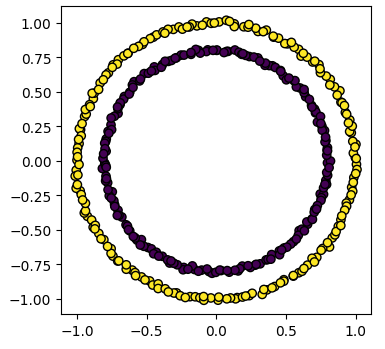
Spectral clustering on the concentric
circles
Unsupervised methods - Dimensionality reduction
Figure 1
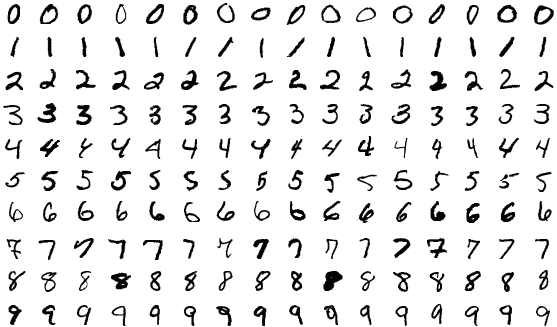
MNIST example illustrating all the classes in
the dataset
Figure 2
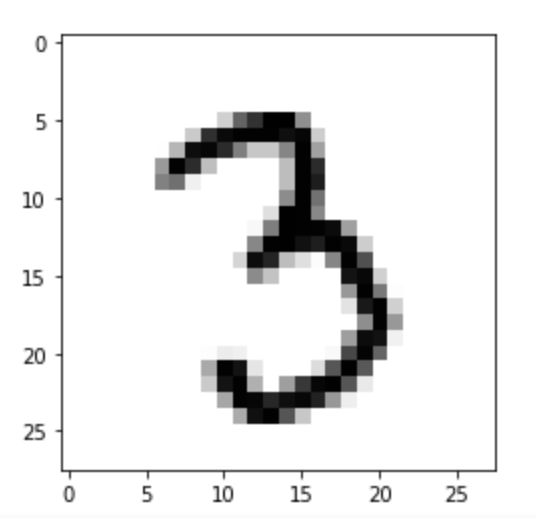
MNIST example of a single image
Figure 3
SKLearn image with highlighted pixels
Figure 4
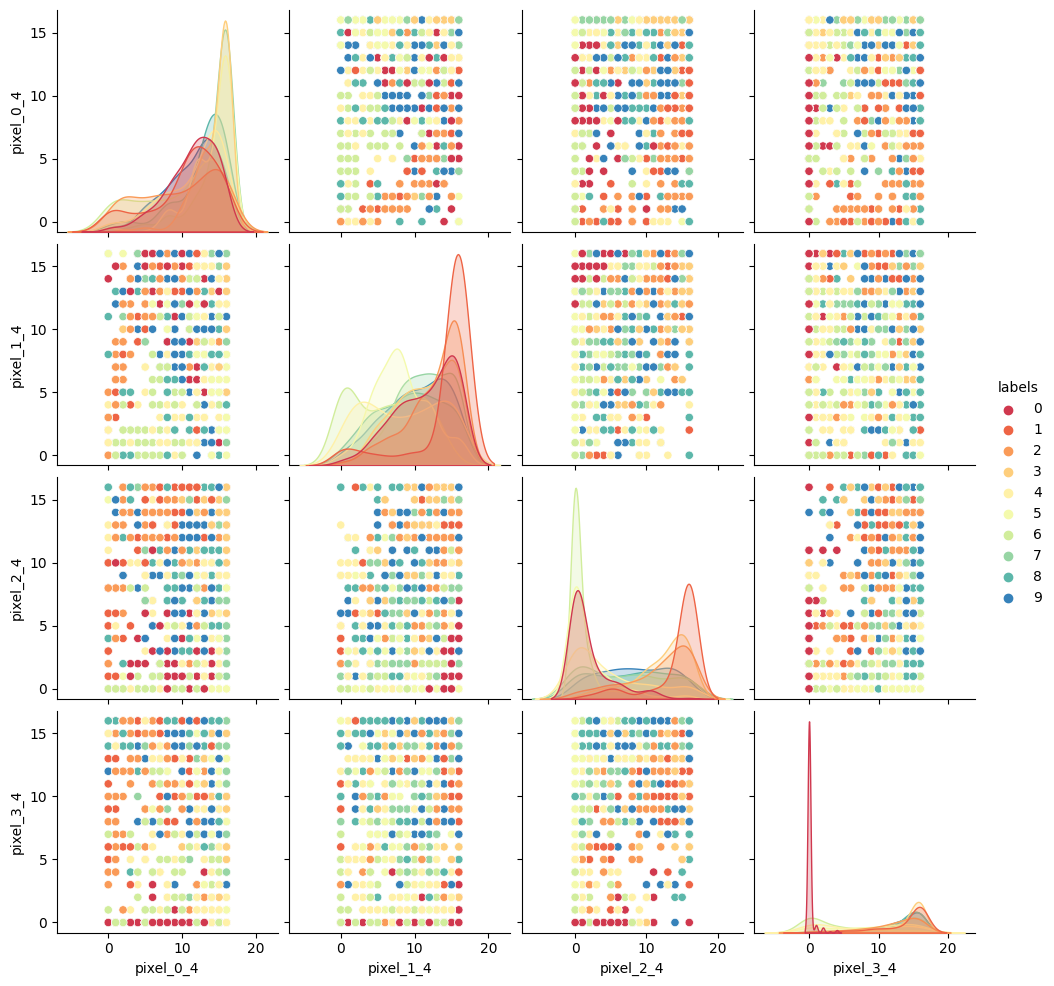
SKLearn image with highlighted pixels
Figure 5
Reduction using PCA
Figure 6
Reduction using PCA, with K-means
clustering
Figure 7
Reduction using PCA, adding colour
labelling
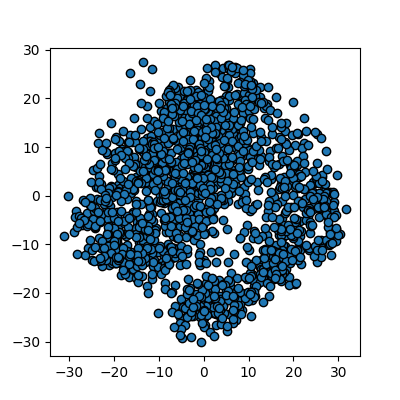
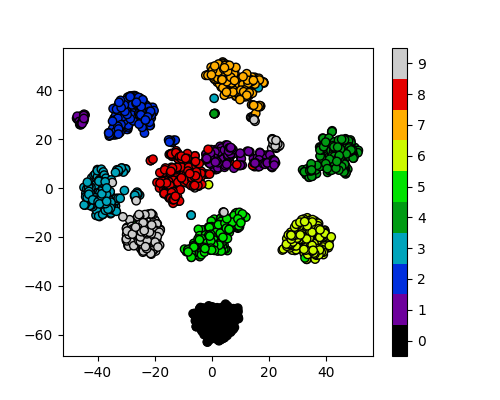
Figure 8
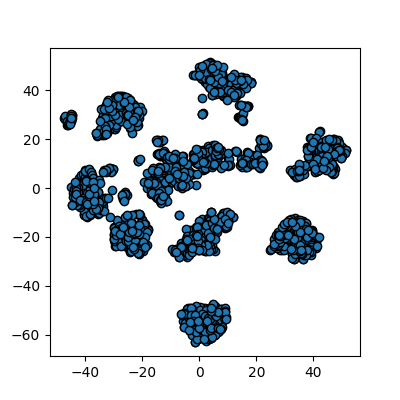
Reduction using PCA, applying t-SNE to the MNIST
data
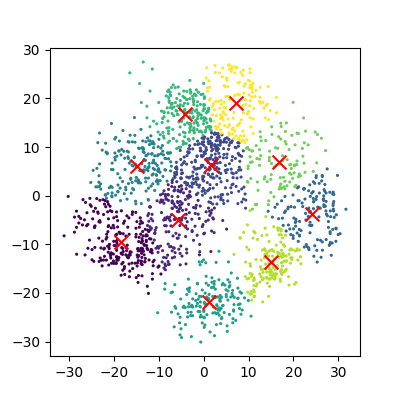
Figure 9
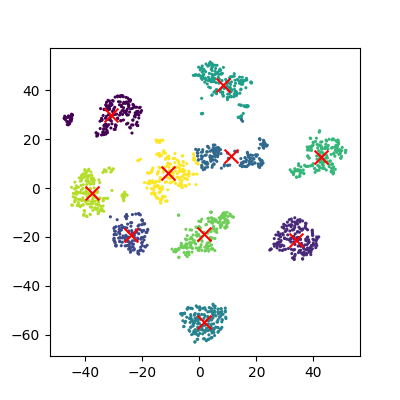
Reduction using PCA, running K-means clustering
on new 2D representation
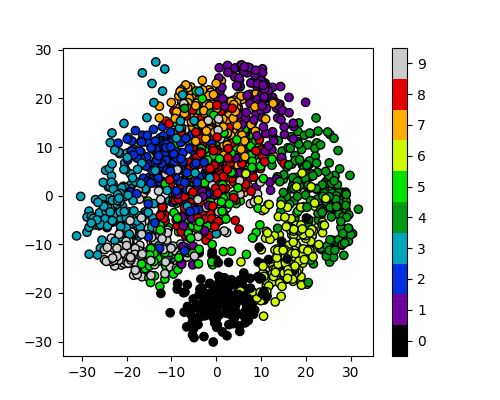
Figure 10
Reduction using PCA, adding in colour
labelling
Figure 11

Reduction to 3 components using pca
Figure 12

Reduction to 3 components using tsne
Neural Networks
Figure 1

A diagram of a perceptron
Figure 2

A multi-layer perceptron