Measuring and improving parallel performance
Last updated on 2025-11-06 | Edit this page
Estimated time: 0 minutes
Overview
Questions
- Why is it important for code to scale well on large HPC systems?
- What can go wrong if we try to optimise too early in the development process?
Objectives
- Describe why code scalability is important when using HPC resources
- Describe the differences between strong and weak scaling
- Summarise the dangers of premature optimisation
When we submit a job to run on a cluster, we have the option of specifying the amount of memory and the number of CPUs (and GPUs) that will be allocated. We also need to consider to what extent that the code is scalable with regards to how it uses the requested resources, to avoid asking for and wasting resources than cannot be used efficiently by the code. Before we start asking for lots of resources, we need to know how the performance of our code scales with the number of CPUs (or GPUs) made available to it. There are two primary measures of performance we should measure:
- Wall clock time (or actual time) - this is the time it takes to run from start of execution to the end, as measured on a clock. In terms of scaling measurements, this does not include any time waiting for the job to start.
- CPU time - this is the time actually spent running your code on a CPU, when it is processing instructions. This does not include time waiting for input or output operations, such as reading in an input file, or any other waiting caused by the cluster’s operating system.
In most cases, measuring just the wall clock time is usually sufficient for working out how your code scales. But what is code scalability?
What is scalability?
Scalability describes how efficiently a program can use additional resources to solve a problem faster, or to handle larger problems. A scalable code continues to achieve performance improvements as more resources are allocated to it. Programs which don’t scale well show diminishing returns as more resources are allocated, often due to bottlenecks such as serial code sections or other overheads. It’s important to note that not all programs need to scale perfectly or to hundreds of thousands of processors. Every program has a practical scaling limit beyond which performance gains level off or even decline. What matters is understanding where the limit lies for your application and what the bottleneck is.
Bottlenecks are the parts of a program that limit its scalability. Even small sections of serial code or operations that require coordination between processors can dominate the total runtime. According to Amdahl’s Law, the speedup of a parallel program is constrained by the fraction which executes serially, so perfect scaling is impossible when any part of the program must execute sequentially. Typical bottlenecks include communication overhead, synchronisation delays, I/O operations, and load imbalance. As processor count increases, these costs can outweigh the benefits of parallel execution, leaving some CPUs idle whilst they wait for others to catchup.
Scalability is measured by observing how the program’s execution time changes as the number of processors increases. This can be quantified through speedup (the ratio of single-processor runtime to multi-processor runtime) and efficiency (the ratio of achieved speedup to the number of processors used). These are calculated through measurements of wall clock time and plotted against the processor count to show how performance scales.
Measuring scalability helps identify whether performance limitations stem from the code itself, the problem size, or the system architecture. Because computing resources are finite, measuring scalability is essential to ensure they are used efficiently. It allows you to determine when adding more cores no longer provides meaningful benefits, preventing wasted resources.
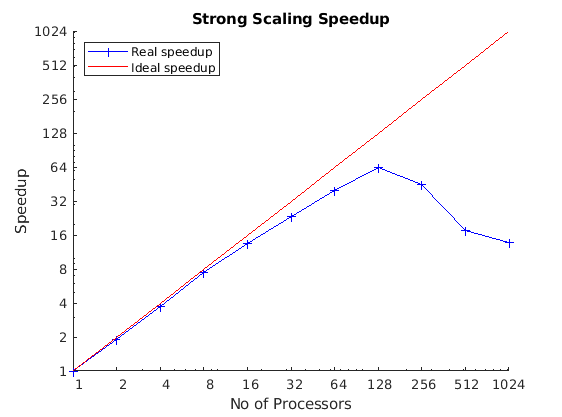
Strong Scaling
Strong scaling measures how execution time changes when the problem size stays constant but the number of processors increases. Ideally, when doubling the processor count we should see expect for the runtime to be halved. In practise, performance gains are limited by serial code and overheads such as communication, synchronisation or I/O operations limited by the file or operating system. When we measure strong scaling, we ideally want to see that by doubling the number of cores, we decrease the execution time by a factor of 2; or see a factor 2 increase in the speedup.
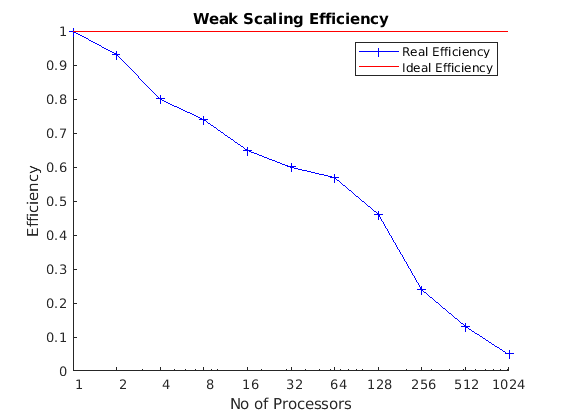
Weak Scaling
Weak scaling measures show runtime changes when both the problem size and number of processors increase proportionally, keeping the workload per processor constant; in contrast, when measuring strong scaling, the workload per processors decreases. It is measured by taking the ratio of the run time against the run time of serial execution. Ideally, the runtime should remain constant as more processors are added. Weak scaling is important for large simulations which would be functionally impossible without a large number of resources.
What affects the scalability?
As we’ve already established, a program’s ability to scale is primarily limited by bottlenecks. Even a small fraction of serial code will eventually dominate the runtime and place a hard limit on performance, regardless of how many processors you add. Beyond the serial fraction, several other factors, often referred to as parallel overheads, degrade scalability:
- Communication overhead: processors running in parallel rarely work in isolation. They need to exchange data, which is done serially. The time spent sending and receiving data is an overhead. As you increase the processor count (especially in strong scaling), the ratio of computation to communication often decreases, meaning processors spend more time talking and less time working.
- Synchronisation delays: parallel tasks often need to coordinate. This can involve waiting at a barrier (a point where all processors must arrive before any can proceed) or waiting to access a shared resource. This waiting time is wasted time where processors are idle.
- Load imbalance: scalability assumes all processors are equally busy. If the work is distributed unevenly, some processors will finish their tasks long before others. These idle processors wait for the slowest ones to catch up, reducing overall efficiency.
- I/O operations: reading from or writing to disk is often a serial bottleneck. If 128 processors try to write to the same file, they may have to do so one after another, nullifying the parallel speedup for that part of the program.
- Problem size: in strong scaling, if the problem size is too small, breaking it across many processors means the overhead (like communication) quickly outweighs the tiny amount of computation each processor performs. In weak scaling, the program’s scalability is tested by how effectively the problem itself can be enlarged while keeping the work-per-processor constant.
The dangers of premature optimisation
If your code is still taking too long to run after parallelising it, or if it scales poorly, it’s tempting to dive head first in and try to optimise everything you think is slow! But before you do that, you need to think about the rules of optimisation:
- Don’t,
- Don’t… yet, and,
- If you need to optimise your code, profile it first.
For most code we write, premature optimisation is often bad practice which leads to long nights of debugging. Optimisation often leads to more complex code resulting in code which is more difficult to read, making it harder to understand and maintain; even with all the code comments in the world! Another issue is that your premature optimisation may change the result without you realising until much further down the line.
It is often effort-intensive, and difficult, particularly with modern compilers and interpreters, to improve on or anticipate the optimisations that compilers already automatically implement for us. It is often better to focus on writing understandable code which does what you want and then only optimise if it too slow, and you have evidence that it is the bottleneck. You will often find that code you think is going to be slow, is often fast enough to not be a problem!
Once you have measured the strong and weak scaling profiles of your code, you can also profile your code to find where the majority of time is being spent to best optimise it. Only then should you start thinking about optimising or even paralleling slow code. If you want to take this philosophy further, consider the Rules of Optimisation Club.
What is profiling?
Profiling your code is all about understanding its complexity and performance characteristics. The usual intent of profiling is to work out how best to optimise your code to improve its performance in some way, typically in terms of speedup or memory and disk usage. In particular, profiling helps identify where bottlenecks exist in your code, and helps avoid summary judgments and guesses which will often lead to unnecessary optimisations.
Each programming language will typically offer some open-source and/or free tools on the web, with you can use to profile your code. Here are some examples of tools. Note though, depending on the nature of the language of choice, the results can be hard or easy to interpret. In the following we will only list open and free tools:
Donald Knuth said “we should forget about small efficiencies, say about 97% of the time: premature optimization is the root of all evil. Yet we should not pass up our opportunities in that critical 3%.” Optimise the obvious trivial things, but avoid non-trivial optimisations until you’ve understood what needs to change. Optimisation is often difficult and time consuming. Pre-mature optimization may be a waste of your time!
Test, test and test again
Following profiling, but before you attempt any optimisation or parallelisation, it is critical to establish a robust test plan. This plan acts as a validation that changes you have made do not change the results of your program or part of the code you have changed. It typically involves a set of known inputs and their “gold standard” correct outputs. Optimisation, and especially parallelisation, can easily introduce subtle bugs, such as race conditions or slight variations in arithmetic, that don’t cause the program to crash but silently changes or corrupt the results. By running through your test plan after each modification, you can immediately verify that your changes have not compromised the correctness of the code.
- Understanding scalability is crucial for using HPC resources efficiently and avoiding waste.
- Scalability measures how efficiently code uses additional resources for a fixed problem (strong scaling) or a proportionally growing problem (weak scaling).
- A program’s scalability is limited by bottlenecks, such as serial code (Amdahl’s Law), communication overhead, I/O, and load imbalance.
- Premature optimisation adds complexity and risks introducing bugs.
- Always profile code first to identify the actual performance bottlenecks before attempting optimisation.
- Establish a robust test plan to verify that any optimisations do not alter the correctness of the results.